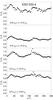
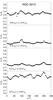
Fig. 10

Left column: the ratio of the thick to thin disc face-on surface density – ΣT/ Σt – for the four axial bins of ESO 533-4. Each data point corresponds to a fitted value obtained using a non-symmetrised PSF rotated φ degrees clockwise with respect to the direction indicated by the mid-plane of ESO 533-4. The grey horizontal lines indicate the ΣT/ Σt values obtained in the fits made using the symmetrised PSF (same as in the bottom panels in Fig. 5). Right column: same as the left column but for NGC 6010 and with ΣT/ Σt values indicated by the horizontal grey line corresponding to Fig. 6.
Current usage metrics show cumulative count of Article Views (full-text article views including HTML views, PDF and ePub downloads, according to the available data) and Abstracts Views on Vision4Press platform.
Data correspond to usage on the plateform after 2015. The current usage metrics is available 48-96 hours after online publication and is updated daily on week days.
Initial download of the metrics may take a while.