Fig. 4
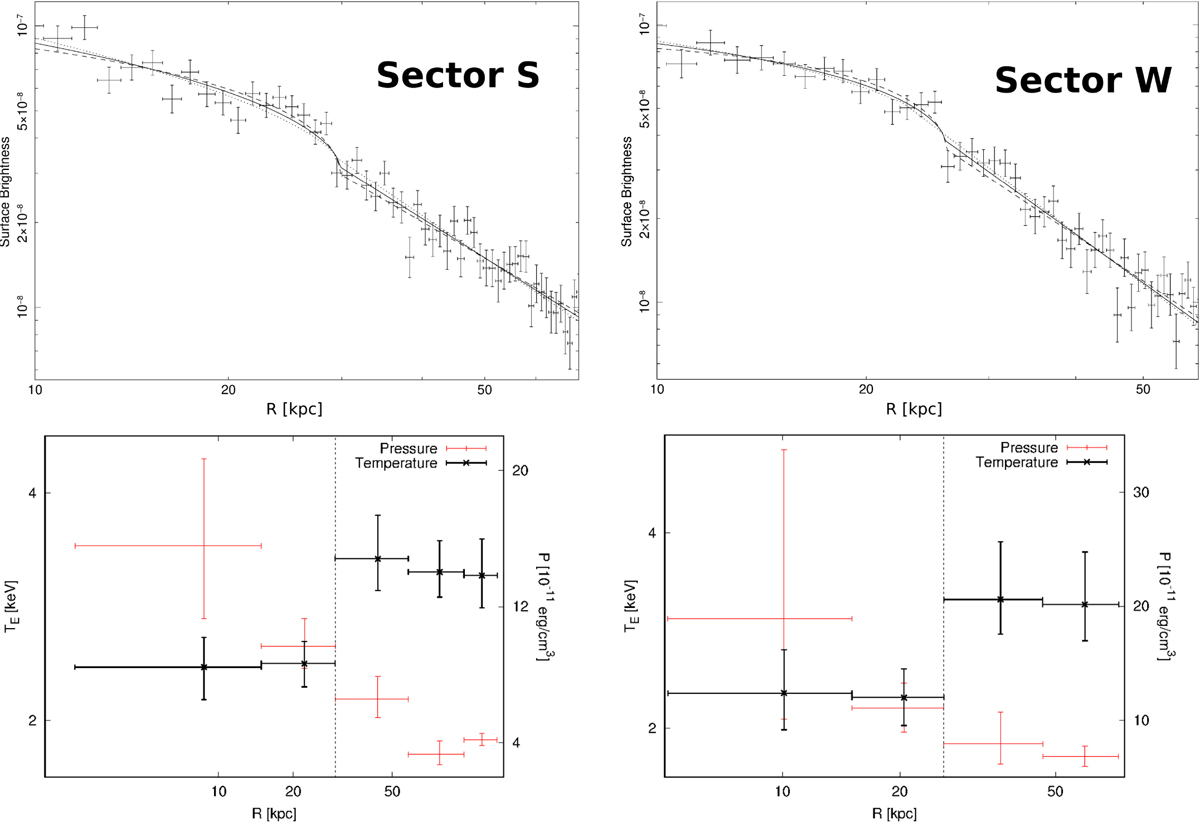
Radial profiles observed in the southern (left) and western (right) sectors reported in Fig. 3. In each panel: Top: SB profile with the best-fit to the broken power-law model. The SB is expressed in units of counts px−2 s−1 , the radius is in units of kpc. The dashed lines show the upper and lower confidence bounds of the best-fit density ratios (corresponding to 1.32![]() for the Sector S and to 1.37
for the Sector S and to 1.37![]() for the Sector W). Bottom: projected temperature (black) and de-projected pressure (red) profiles. The black dashed line indicates the position of the front determined by the broken power-law fit to the SB profile shown in the upper panels.
for the Sector W). Bottom: projected temperature (black) and de-projected pressure (red) profiles. The black dashed line indicates the position of the front determined by the broken power-law fit to the SB profile shown in the upper panels.
Current usage metrics show cumulative count of Article Views (full-text article views including HTML views, PDF and ePub downloads, according to the available data) and Abstracts Views on Vision4Press platform.
Data correspond to usage on the plateform after 2015. The current usage metrics is available 48-96 hours after online publication and is updated daily on week days.
Initial download of the metrics may take a while.