Fig. 1
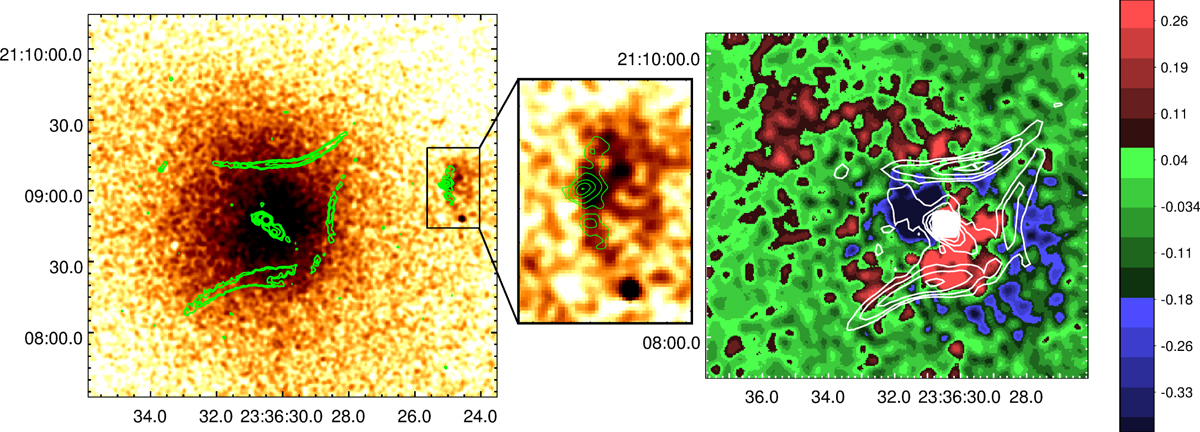
Left: 0.5–2 keV Chandra image of A2626 smoothed with a 3-pixel Gaussian filter (1 ACIS pixel = 0.5″), with a zoom on IC5337 and with the 1.4 GHz radio emission overlaid in green contours (from Fig. 2 of Gitti 2013, resolution ~1.2″). Right: SB residual map obtained by subtracting the β-model, smoothed with an 8-pixel Gaussian filter (color map), and with the 1.4 GHz radio emission overlaid in white contours (from Fig. 3 of Gitti 2013, resolution ~4.2″). As indicated by the color-bar on the right, the over-densities in units of counts px−2 s−1 are shown in red and the subdensities in blue.
Current usage metrics show cumulative count of Article Views (full-text article views including HTML views, PDF and ePub downloads, according to the available data) and Abstracts Views on Vision4Press platform.
Data correspond to usage on the plateform after 2015. The current usage metrics is available 48-96 hours after online publication and is updated daily on week days.
Initial download of the metrics may take a while.