Fig. 4
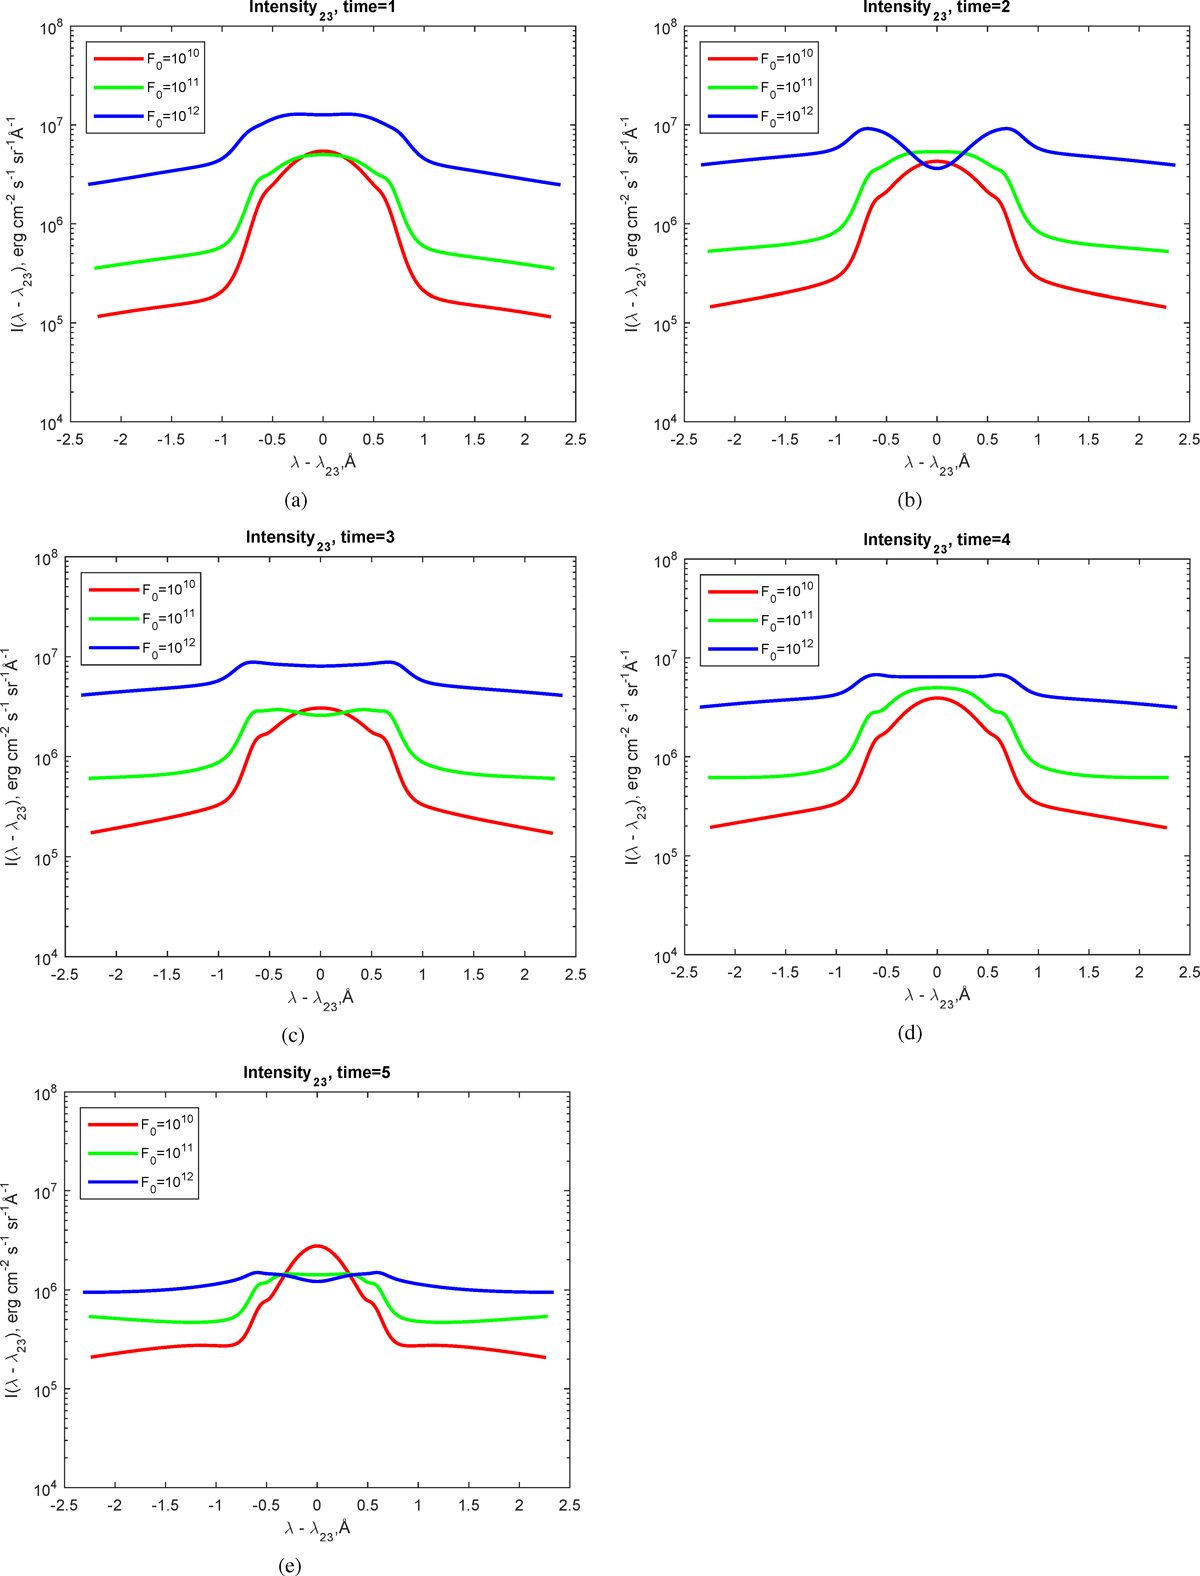
Profiles of Hα line intensityenhancements, in erg cm−2 s−1 sr−1 Å−1, plotted vs. distance in Å from the line central wavelength for times from 1 to 5 s in panels (a) to (e), respectively.Results are shown for the F12 (blue line), F11 (green line), and F10 (red line) beam models. The colour scheme for the lines representing these models is also used in Figs. 5 to 10.
Current usage metrics show cumulative count of Article Views (full-text article views including HTML views, PDF and ePub downloads, according to the available data) and Abstracts Views on Vision4Press platform.
Data correspond to usage on the plateform after 2015. The current usage metrics is available 48-96 hours after online publication and is updated daily on week days.
Initial download of the metrics may take a while.