Fig. 5
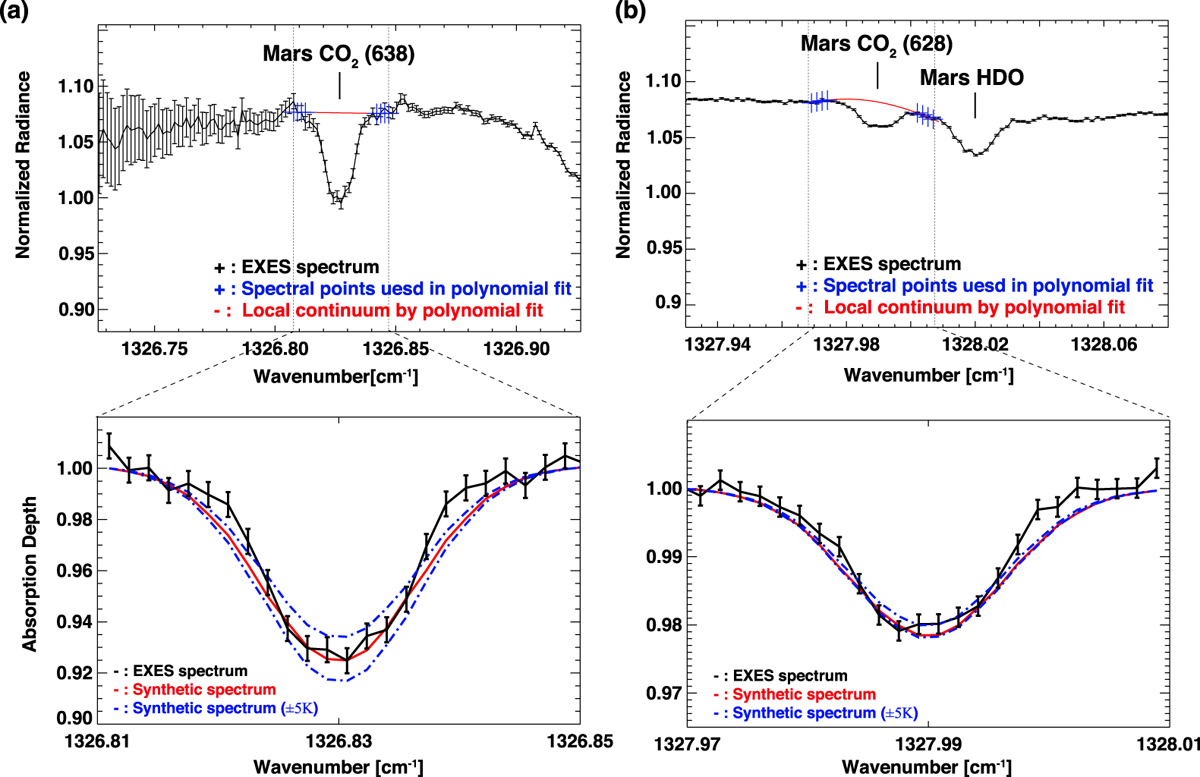
Examples of extraction of the Martian CO2 lines and their comparison with the synthetic spectra calculated by our radiative transfer codes. Those of CO2 (638) line at 1326.75438 cm−1 and CO2 (628) line at 1327.917522 cm−1 are shown in panels a and b, respectively. The positions of these lines are shifted due to the Doppler velocity between Mars and Earth. The black curves shown in the upper panels are the averaged EXES spectrum. The slit position is “Mars Center ♯1”, and the mean Latitude, Longitude, and Local time of the averaged spectrum are 17∘ S, 181∘ W, and 16 h, respectively. In the upper panel of panel b, an absorption band due Martian HDO is also visible. We note that error values in the left wing of the Martian CO2 (638) line are relatively high because they are close to the edge of the slit. The red curves and blue points in the upper panels show the local continuums established by the cubic polynomial fit and the spectral points used to perform the cubic polynomial fit, respectively. In the lower panels, the black curves represent the transmittance spectra due to Mars atmosphere that are the EXES spectrum divided by the local continuum. The red curves are synthetic spectra calculated with the vertical temperature profiles extracted from MCD, and the blue curves show the ones with the temperature profiles shifted by ±5 K. The extracted spectral features of the Martian CO2 lines show a good agreement with the synthetic spectra even though there is a small disparity appeared in the wings.
Current usage metrics show cumulative count of Article Views (full-text article views including HTML views, PDF and ePub downloads, according to the available data) and Abstracts Views on Vision4Press platform.
Data correspond to usage on the plateform after 2015. The current usage metrics is available 48-96 hours after online publication and is updated daily on week days.
Initial download of the metrics may take a while.