Fig. 4
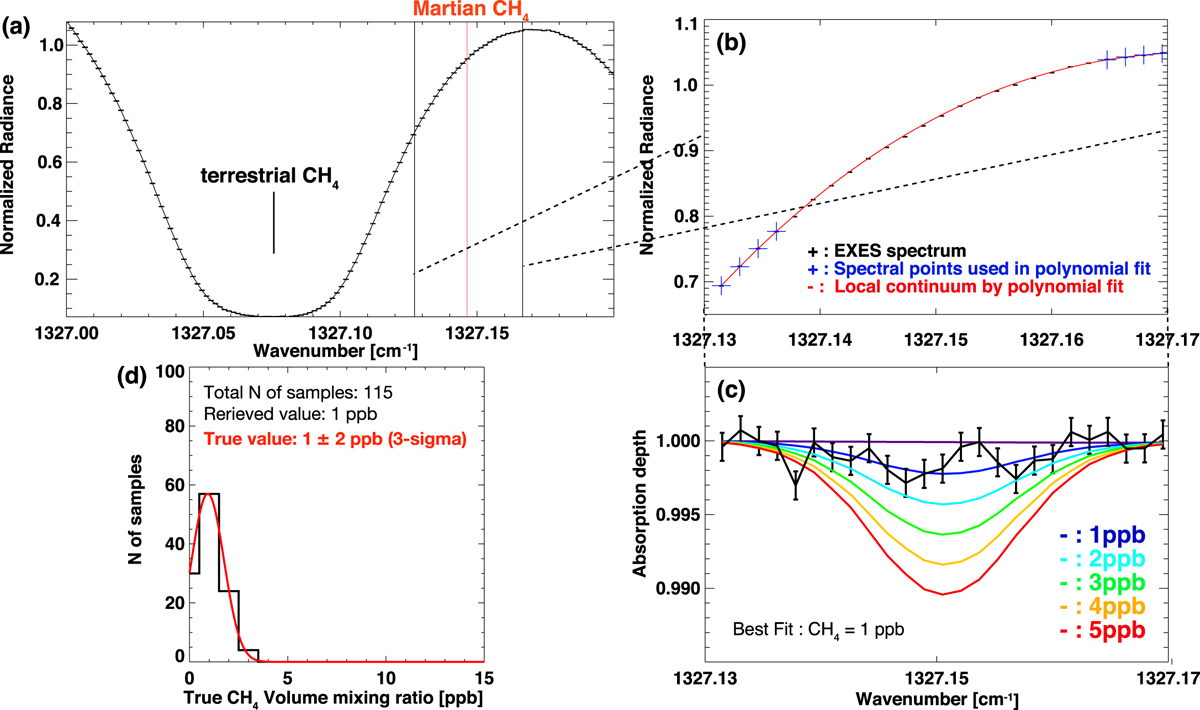
Example of data analysis. Panel a: black curve shows the averaged EXES spectrum (over one-third of the entire slit) in the spectral range between 1327.0 and 1327.2 cm−1 . The slit position is “Mars Center ♯1”, and the mean Latitude, Longitude, and Local time of the averaged spectrum are 40∘ N, 247∘ W, and 12h, respectively. The strong absorption due the terrestrial CH4 is visible at 1327.074219 cm−1. The red vertical bar shows the expected spectral position of the Martian CH4 line shifted due to Doppler velocity between Earth and Mars. The black bars represent the spectral range which was used for retrieval of CH4 mixing ratio on Mars. Panel b: black points are the same EXES spectrum as shown in panel a but focused around the expected Martian CH4 lines. The red curve shows the local continuum established by the cubic polynomial fit. The blue points represent the spectral points used to perform the cubic polynomial fit. Panel c: black curve shows the absorption depth spectrum due to Mars atmosphere that is the EXES spectrum divided by the local continuum. The color curves are the synthetic absorption depth with various mixing ratio of the Martian CH4 (blue: 1 ppb, light blue: 2 ppb, green: 3 ppb, orange: 4 ppb, red: 5 ppb) that is the synthetic spectrum with the Martian CH4 divided by the one without the Martian CH4. The one with 1 ppb of CH4 mixing ratio (the blue one) provides the minimum cost function (i.e., the best-fit synthetic spectrum). Panel d: true CH4 mixing ratio when the retrieved CH4 mixing ratio is 1 ppb. The histogram is obtained from the retrieval test using simulated EXES spectra (see Sect. section 3.4). The uncertainty of this retrieval is estimated to be 2 ppb (3σ) from the histogram.
Current usage metrics show cumulative count of Article Views (full-text article views including HTML views, PDF and ePub downloads, according to the available data) and Abstracts Views on Vision4Press platform.
Data correspond to usage on the plateform after 2015. The current usage metrics is available 48-96 hours after online publication and is updated daily on week days.
Initial download of the metrics may take a while.