Fig. 3
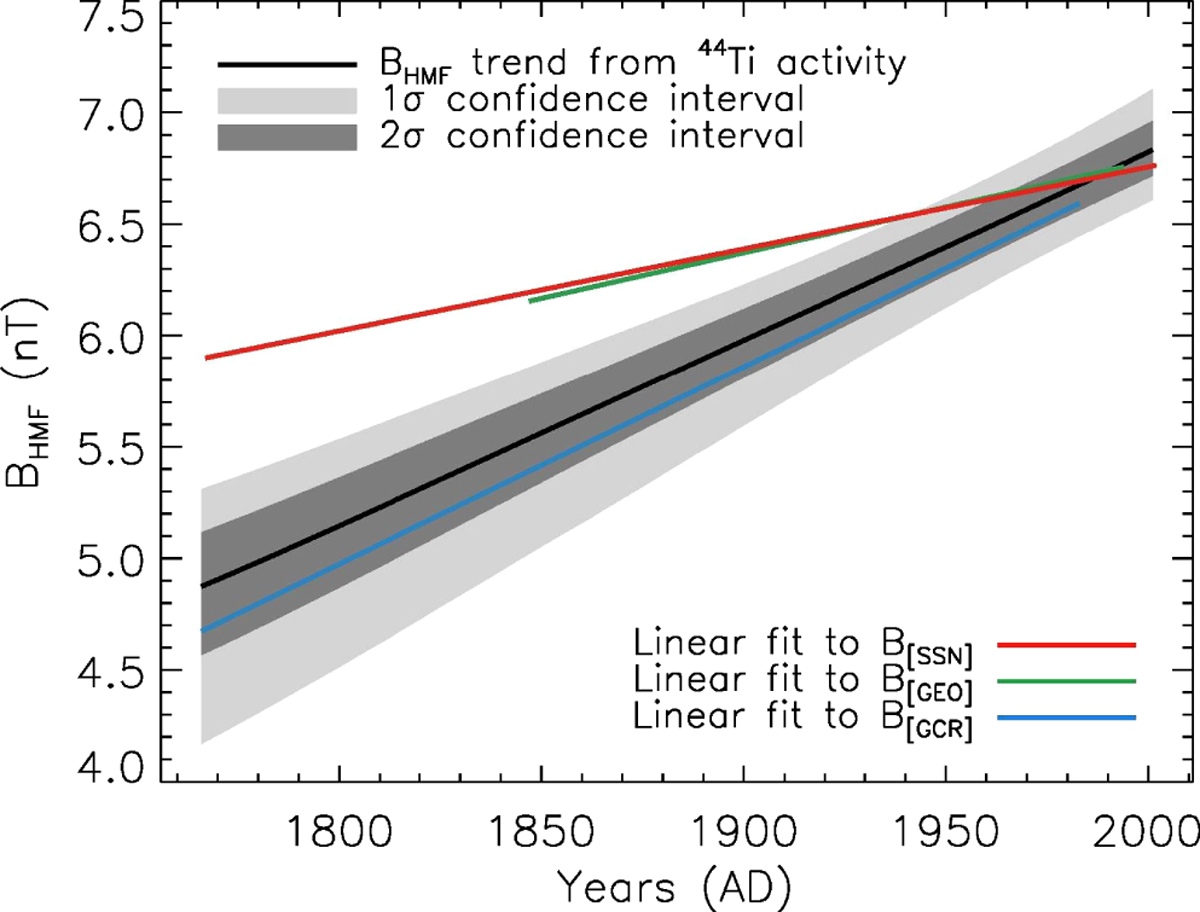
Long-term trend of BHMF between 1766 and 2001 (black line) as obtained by using the A(t) trend derived from the measured 44Ti data. The 1σ (68.27%) and 2σ (95.45%) confidence bands (depicted with dark-gray and light-gray shaded areas, respectively) were obtained by propagating the uncertainties in the model (see text for details). The colored curves are linear fits to the geomagnetic-based, sunspot-based and 10Be-based composite reconstructions of the BHMF as given by Owens et al. (2016a,b).
Current usage metrics show cumulative count of Article Views (full-text article views including HTML views, PDF and ePub downloads, according to the available data) and Abstracts Views on Vision4Press platform.
Data correspond to usage on the plateform after 2015. The current usage metrics is available 48-96 hours after online publication and is updated daily on week days.
Initial download of the metrics may take a while.