Fig. 1
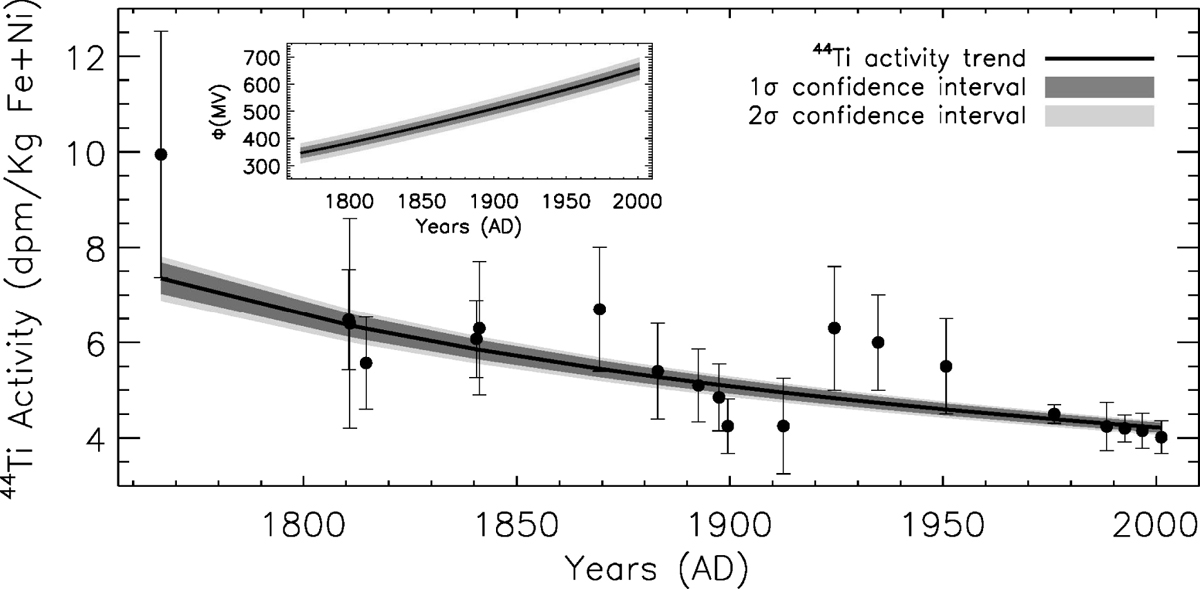
Time profile of the measured 44Ti activity in units of disintegrations per minute per kg of Fe + Ni for meteorites which fell between 1766 and 2001. Black dots depict measurements in meteorites. Error bars correspond to 1σ uncertainties in the 44Ti activity. The black curve represents the trend of the 44Ti activity as given by a χ2 fit of Model 11 to the data. Dark-gray and light-gray shaded areas denote, respectively, the 1σ (68.27%) and 2σ (95.45%) confidence bands. The inset shows the time profile of the modulation potential (in MV) obtained from inverting Eq. (3) (see text for details).
Current usage metrics show cumulative count of Article Views (full-text article views including HTML views, PDF and ePub downloads, according to the available data) and Abstracts Views on Vision4Press platform.
Data correspond to usage on the plateform after 2015. The current usage metrics is available 48-96 hours after online publication and is updated daily on week days.
Initial download of the metrics may take a while.