Fig. 9
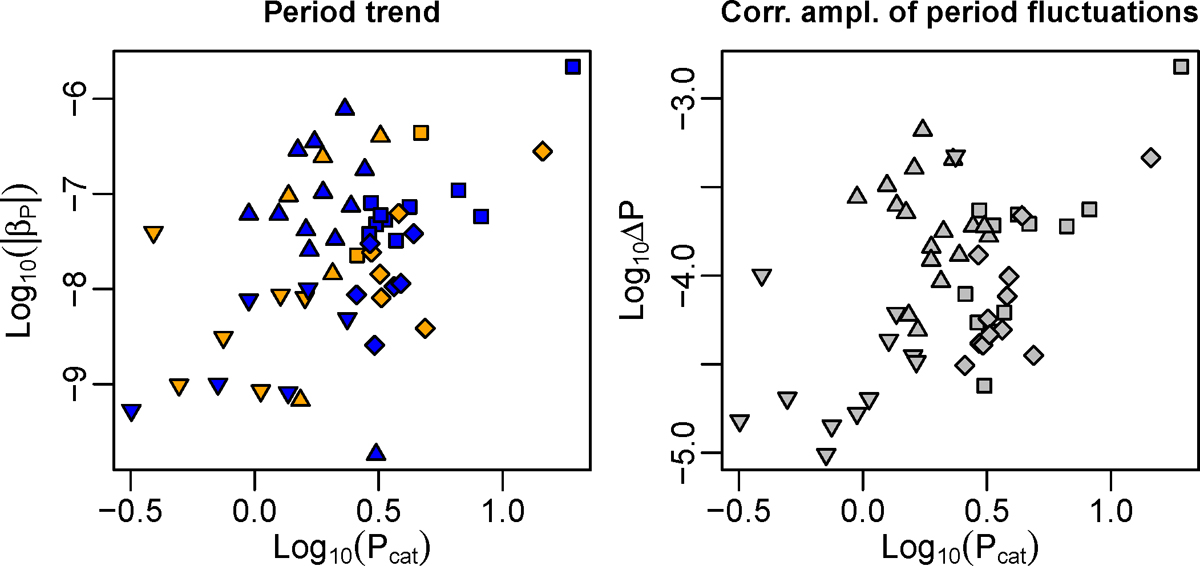
Period trend ∣ βP ∣ (left panel) and size of period fluctuations ΔP (right panel) as estimated from model (2) for the 53 Cepheids. Downward pointing triangles: control overtone Cepheids, upward pointing triangles: overtone twin-peak Cepheids, diamonds: fundamental-mode control Cepheids, squares: fundamental-mode twin-peak stars. In the left plot, negative trends are indicated in blue, positive ones in orange.
Current usage metrics show cumulative count of Article Views (full-text article views including HTML views, PDF and ePub downloads, according to the available data) and Abstracts Views on Vision4Press platform.
Data correspond to usage on the plateform after 2015. The current usage metrics is available 48-96 hours after online publication and is updated daily on week days.
Initial download of the metrics may take a while.