Fig. 8
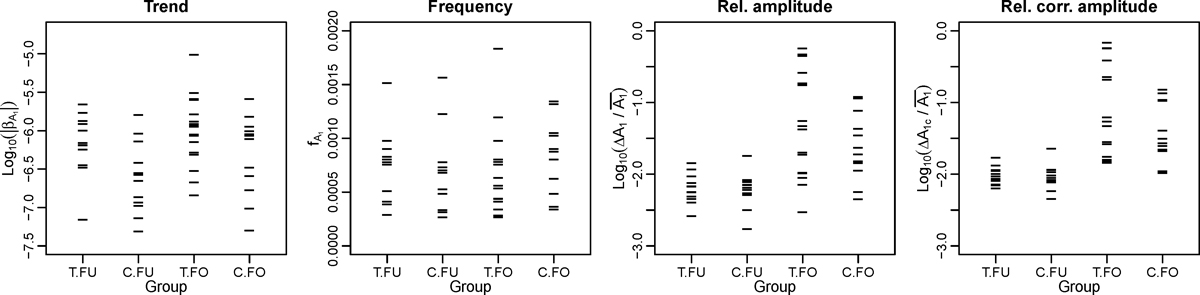
Distribution of the logarithm of the absolute trend ![]() (leftmost panel), the frequency of the oscillatory term
(leftmost panel), the frequency of the oscillatory term ![]() (second panel) and the logarithm of its relative size, that is, the (uncorrected and corrected) size of the changes
ΔA1
and ΔA1c
divided by Ā1,
the first harmonic amplitude of the average stable-model (third and rightmost panels, respectively), estimated from
model (2). Groups and their labels are the same as in Fig. 7.
(second panel) and the logarithm of its relative size, that is, the (uncorrected and corrected) size of the changes
ΔA1
and ΔA1c
divided by Ā1,
the first harmonic amplitude of the average stable-model (third and rightmost panels, respectively), estimated from
model (2). Groups and their labels are the same as in Fig. 7.
Current usage metrics show cumulative count of Article Views (full-text article views including HTML views, PDF and ePub downloads, according to the available data) and Abstracts Views on Vision4Press platform.
Data correspond to usage on the plateform after 2015. The current usage metrics is available 48-96 hours after online publication and is updated daily on week days.
Initial download of the metrics may take a while.