Fig. 6
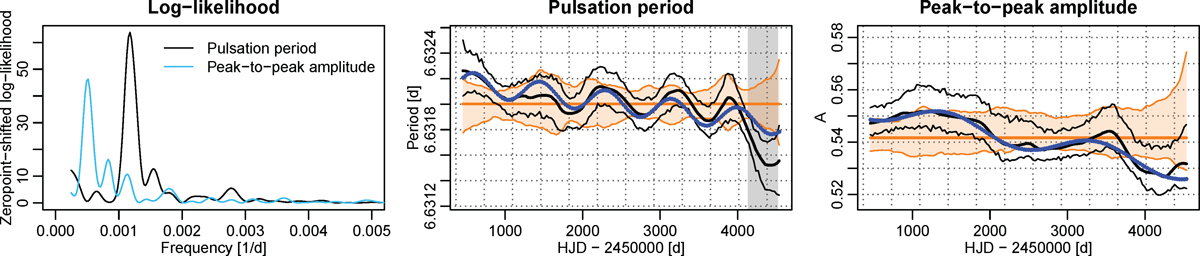
CEP-1748 shown as example of the heuristic model (2) of the changes of the pulsation parameters. Left panel: the log-likelihoods for the pulsation period (in black) and the peak-to-peak amplitude (in blue; the log-likelihood functions were shifted to have common minimum at zero). The other two panels show the fits using the frequency yielding the highest likelihood (blue dots) against the sliding window estimates (thick black line), their 95% confidence interval (thin black lines), the stable value from the reference fit (thick orange line) and its confidence band (orange band). The middle panel presents the variations of the pulsation period, the right panel those of the peak-to-peak amplitude.
Current usage metrics show cumulative count of Article Views (full-text article views including HTML views, PDF and ePub downloads, according to the available data) and Abstracts Views on Vision4Press platform.
Data correspond to usage on the plateform after 2015. The current usage metrics is available 48-96 hours after online publication and is updated daily on week days.
Initial download of the metrics may take a while.