Fig. 4
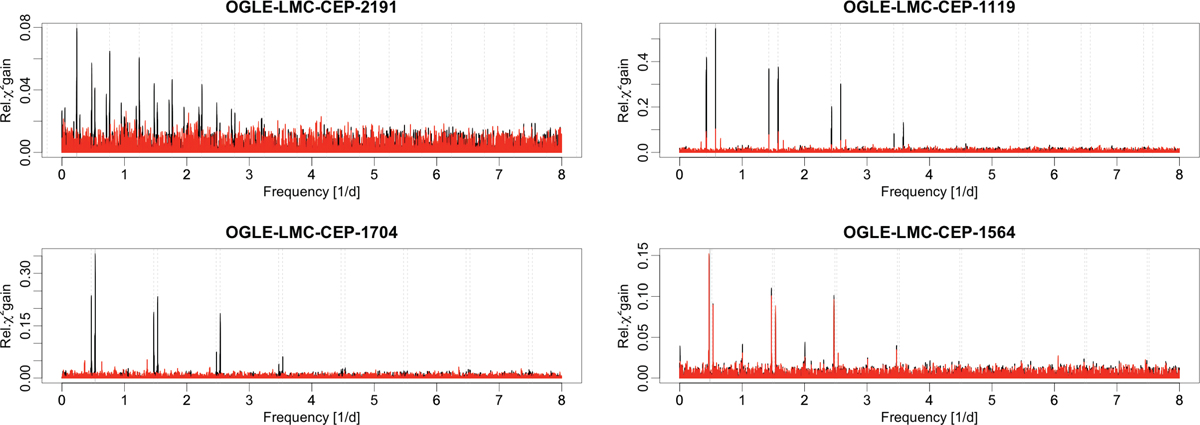
Four examples of the effect of the sliding window smoothing on residual periodograms. The GLS periodogram of the residuals from the stable reference model is plotted in black. Twin peaks appear very close to the gray background vertical line that indicates the primary pulsation frequency. Daily aliases of the primary frequency are shown as dashed vertical gray lines. We superposed the periodogram of the residuals from the sliding window fit in red.
Current usage metrics show cumulative count of Article Views (full-text article views including HTML views, PDF and ePub downloads, according to the available data) and Abstracts Views on Vision4Press platform.
Data correspond to usage on the plateform after 2015. The current usage metrics is available 48-96 hours after online publication and is updated daily on week days.
Initial download of the metrics may take a while.