Fig. 3
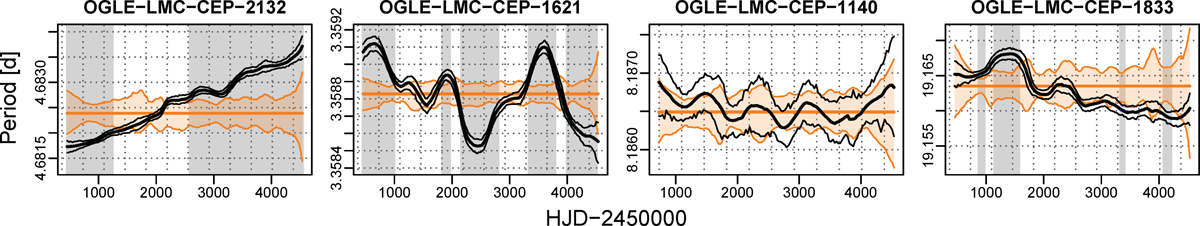
Examples for the basic types of period modulation found among the Cepheids. The plots show the kernel-estimated pulsation period (in days) versus Julian Date (in days), plotted as a solid thick black line, together with its bootstrapped pointwise CI (thin black lines; see Sect. 2.2). The heavy orange line denotes the catalog period, which was used as known (non-optimized) value in the fitted stable reference model for the Cepheid. The orange band indicates the nonparametric bootstrap CI around this period, obtained from the procedure described in Sect. 2.2. The dotted black horizontal and vertical lines are aids to the eye to estimate the extent and time interval of the changes. The gray background highlights time intervals where the deviation from the stable reference model was found significant by a multiple testing procedure (Benjamini & Yekutieli 2001). Leftmost panel: near-linear trend, middle left: stochastic fluctuations, middle right: quasi-periodic instabilities, rightmost: combination of a trend and weakening quasi-periodic changes.
Current usage metrics show cumulative count of Article Views (full-text article views including HTML views, PDF and ePub downloads, according to the available data) and Abstracts Views on Vision4Press platform.
Data correspond to usage on the plateform after 2015. The current usage metrics is available 48-96 hours after online publication and is updated daily on week days.
Initial download of the metrics may take a while.