Fig. D.5
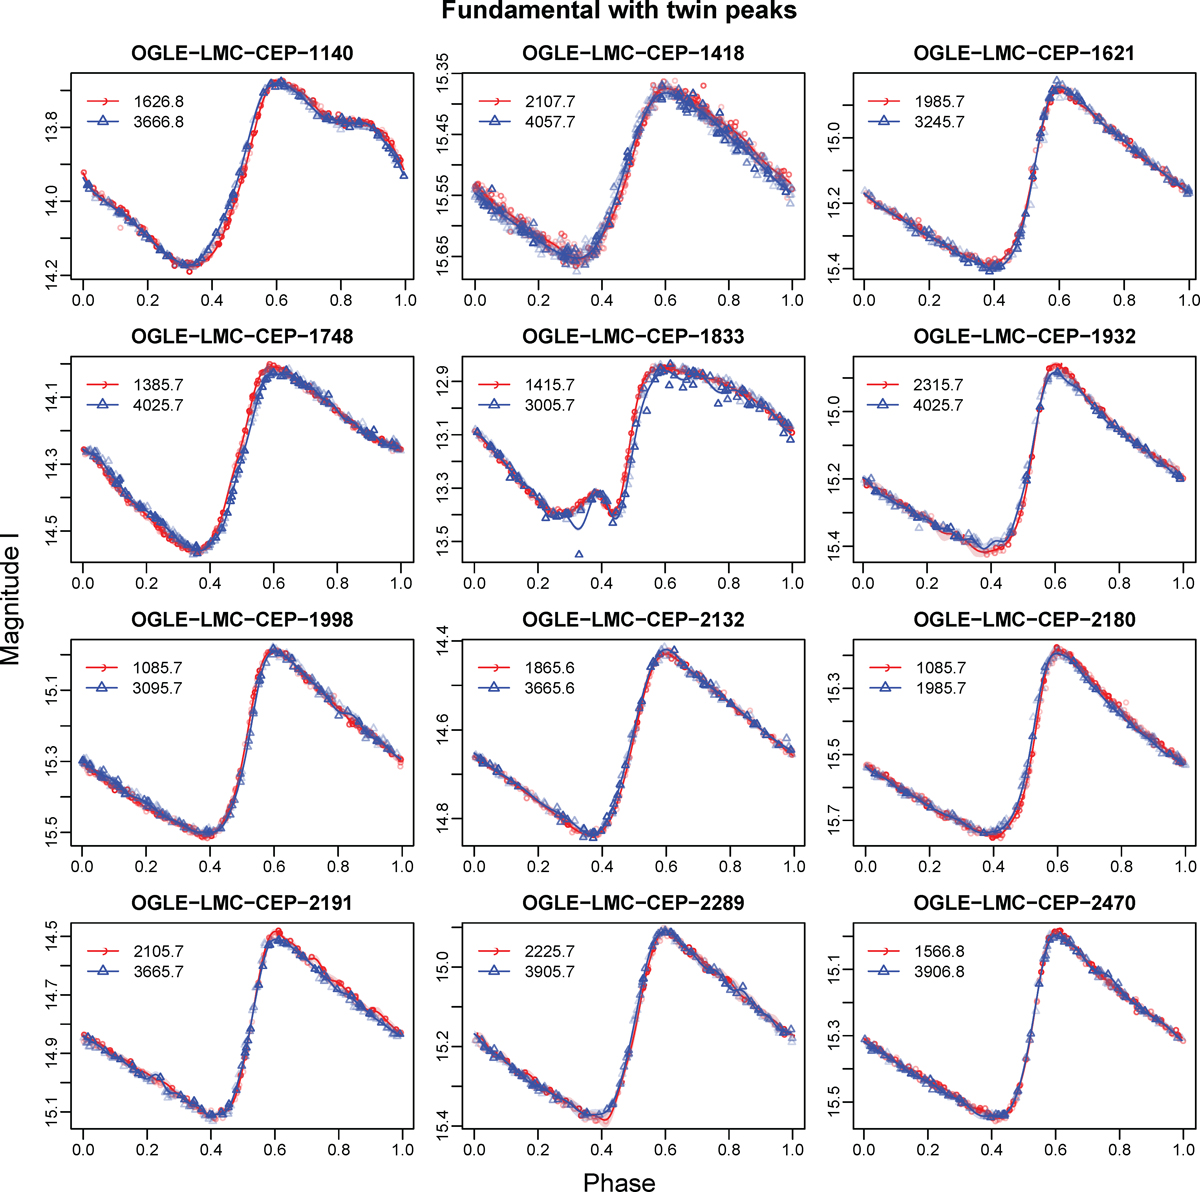
Kernel-estimated light curve shapes in two little- or non-overlapping windows for twin-peak fundamental Cepheids, inwhich the peak-to-peak amplitude or the amplitude of the leading harmonic term was very different. Fitted curves are indicated by the lines of different colors, and the observations in the different windows, by the different colors and shapes of the symbols. The times of the window centers are given in the legend. The observations close to the window center and therefore more influential in the fit have darker red or blue colors, whereas those in the wings are shown in lighter shades. Approximate bootstrap confidence intervals for the curves are given as light red and light blue stripes around the estimated lines (Sect. 2.2 and Appendix A).
Current usage metrics show cumulative count of Article Views (full-text article views including HTML views, PDF and ePub downloads, according to the available data) and Abstracts Views on Vision4Press platform.
Data correspond to usage on the plateform after 2015. The current usage metrics is available 48-96 hours after online publication and is updated daily on week days.
Initial download of the metrics may take a while.