Fig. D.1
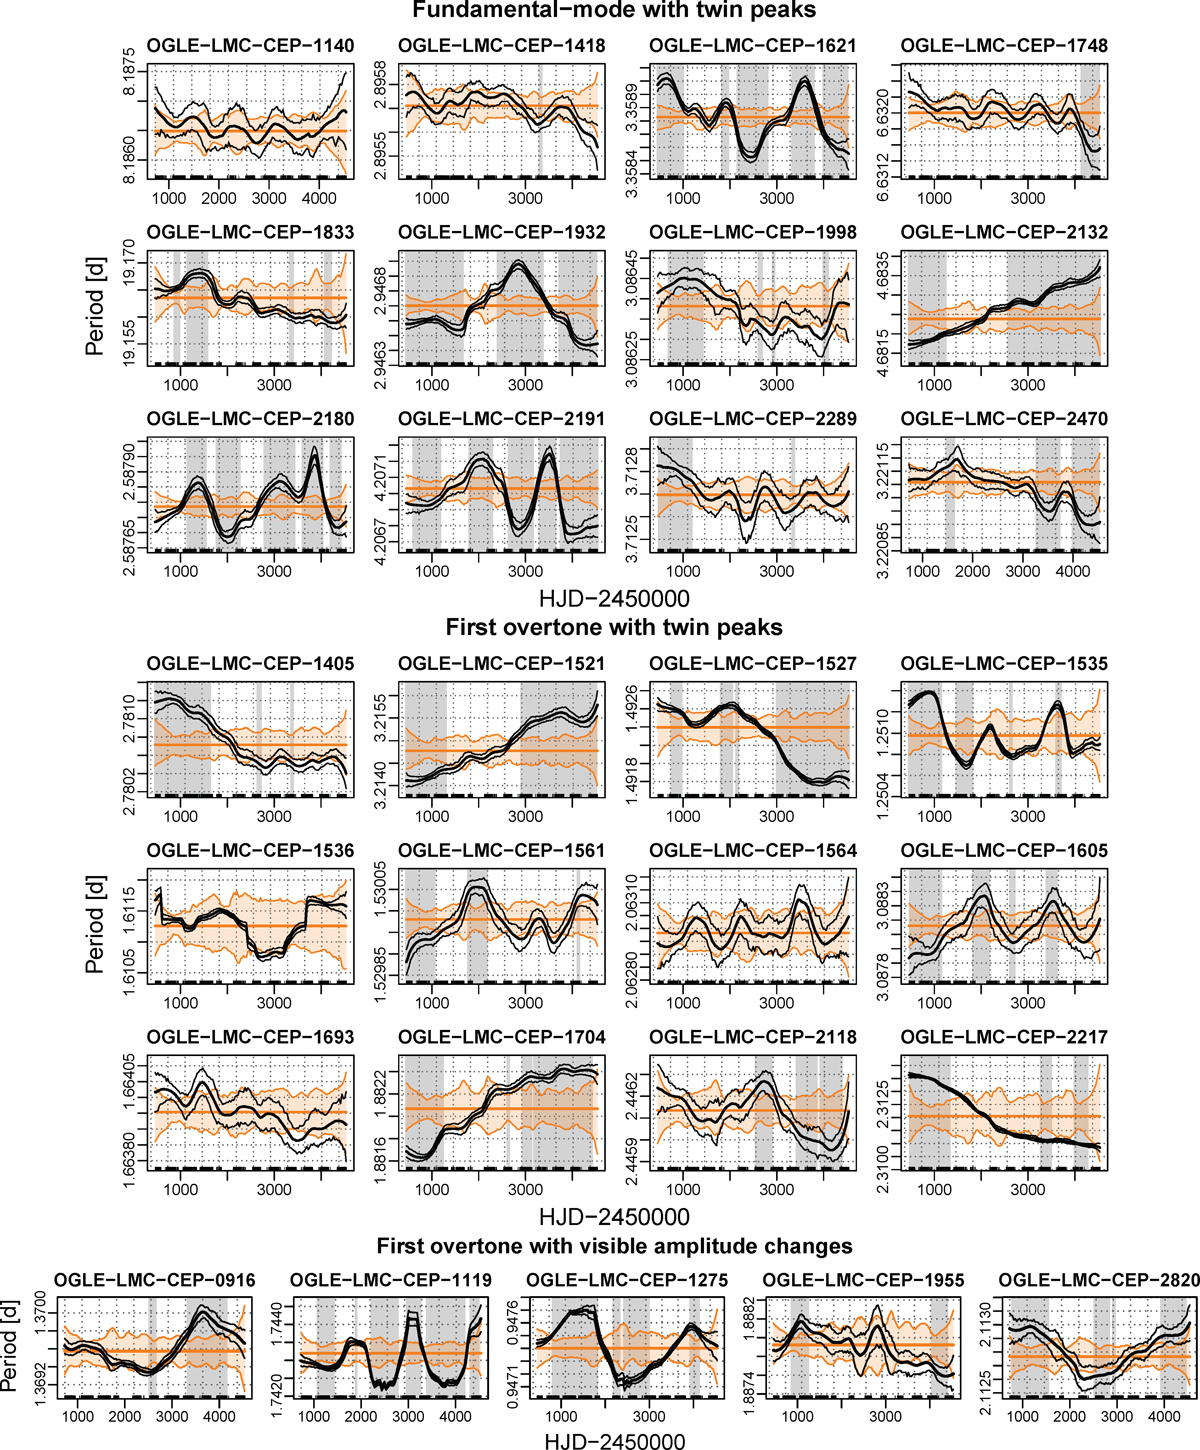
Temporal variation of the pulsation period of the twin-peak Cepheids (solid thick black line), together with its bootstrapped pointwise CI (thin black lines). Heavy orange line: catalog period, orange band: 95% nonparametric bootstrap CI around this period based on the bootstrap procedureof Sect. A.2. The dotted black vertical lines indicate years after HJD − 2 450 000. The gray background highlights time intervals where the deviation from the stable reference model was found significant (cf. Sect. A.3). The times of the observations are indicated with a rugplot at the bottom of the panels.
Current usage metrics show cumulative count of Article Views (full-text article views including HTML views, PDF and ePub downloads, according to the available data) and Abstracts Views on Vision4Press platform.
Data correspond to usage on the plateform after 2015. The current usage metrics is available 48-96 hours after online publication and is updated daily on week days.
Initial download of the metrics may take a while.