Fig. C.2
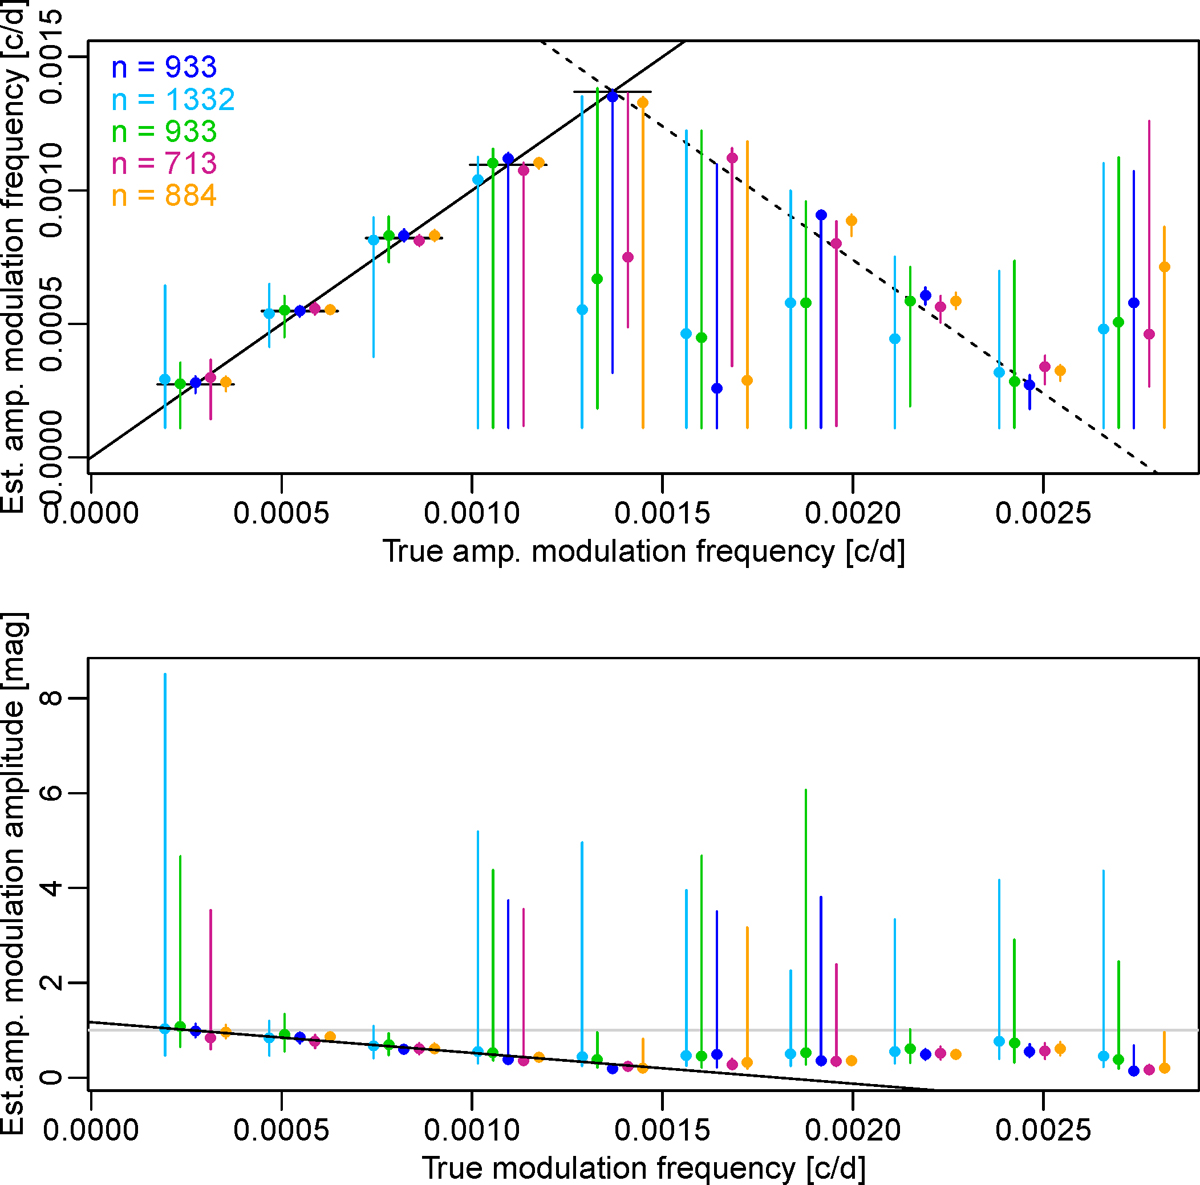
The modulation frequency (top panel) and the ratio between the modulation amplitude and the true amplitude (bottom panel) estimated by model (2) applied to local sliding window estimates of simulated amplitude modulations. The notation is the same as in Fig. C.1 The solid black line is the best linear fit using the five mediansat each modulation frequency corresponding to the five lowest true modulation frequencies.
Current usage metrics show cumulative count of Article Views (full-text article views including HTML views, PDF and ePub downloads, according to the available data) and Abstracts Views on Vision4Press platform.
Data correspond to usage on the plateform after 2015. The current usage metrics is available 48-96 hours after online publication and is updated daily on week days.
Initial download of the metrics may take a while.