Fig. C.1
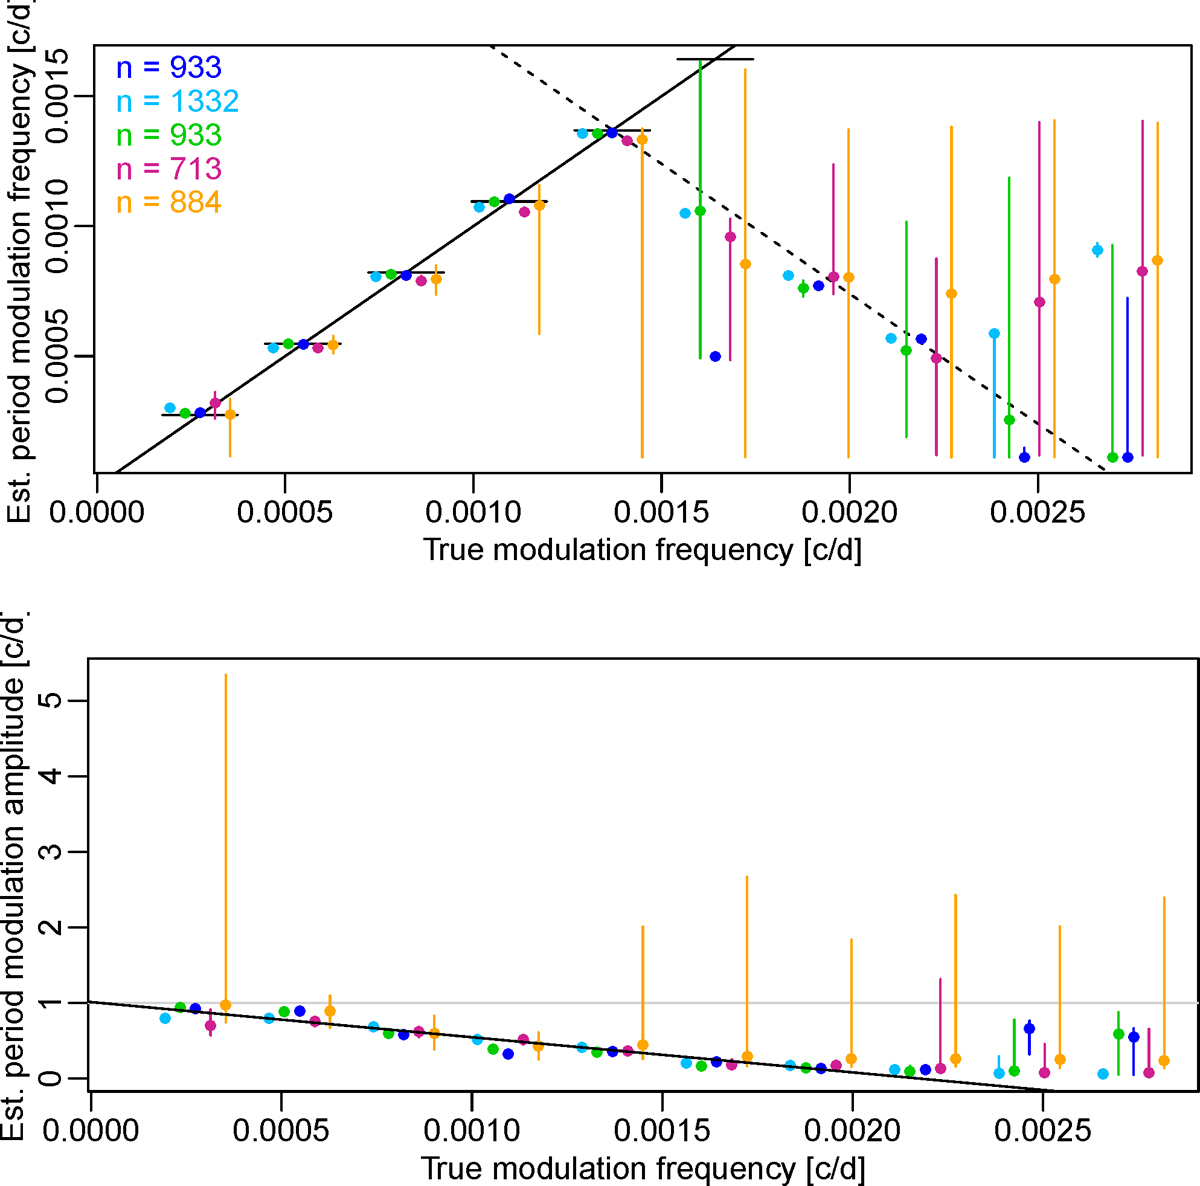
Modulation frequency (top panel) and the ratio between the modulation amplitude and the true amplitude (bottom panel) estimated by model (2) applied to local sliding window estimates of simulated period modulations. Colored dots show the median of the estimates based on 200 different Gaussian noise realizations added to each of five simulated modulated light curves, and vertical segments indicate the range between the 0.025 and 0.975 quantiles. Cyan: using parameters of CEP-1527, green: CEP-2217, blue: CEP-2191, dark red: CEP-1140, orange: CEP-1833. All simulations used the same sequence of true modulation frequencies. For visibility, the dots based on different Cepheids are horizontally offset from the true value. In the top panel, the solid black line indicates x = y, i.e., the location of accurate estimates, with short horizontal segments aiding the eye as to where horizontally offset points should lie. The dashed line indicates the yearly alias of the x = y line. In the bottom panel, the horizontal gray line indicates y = 1, the location of the ratios in case of unbiased estimates. The solid black line is the best linear fit using the five medians at each modulation frequency corresponding to the seven lowest true modulation frequencies.
Current usage metrics show cumulative count of Article Views (full-text article views including HTML views, PDF and ePub downloads, according to the available data) and Abstracts Views on Vision4Press platform.
Data correspond to usage on the plateform after 2015. The current usage metrics is available 48-96 hours after online publication and is updated daily on week days.
Initial download of the metrics may take a while.