Fig. B.2
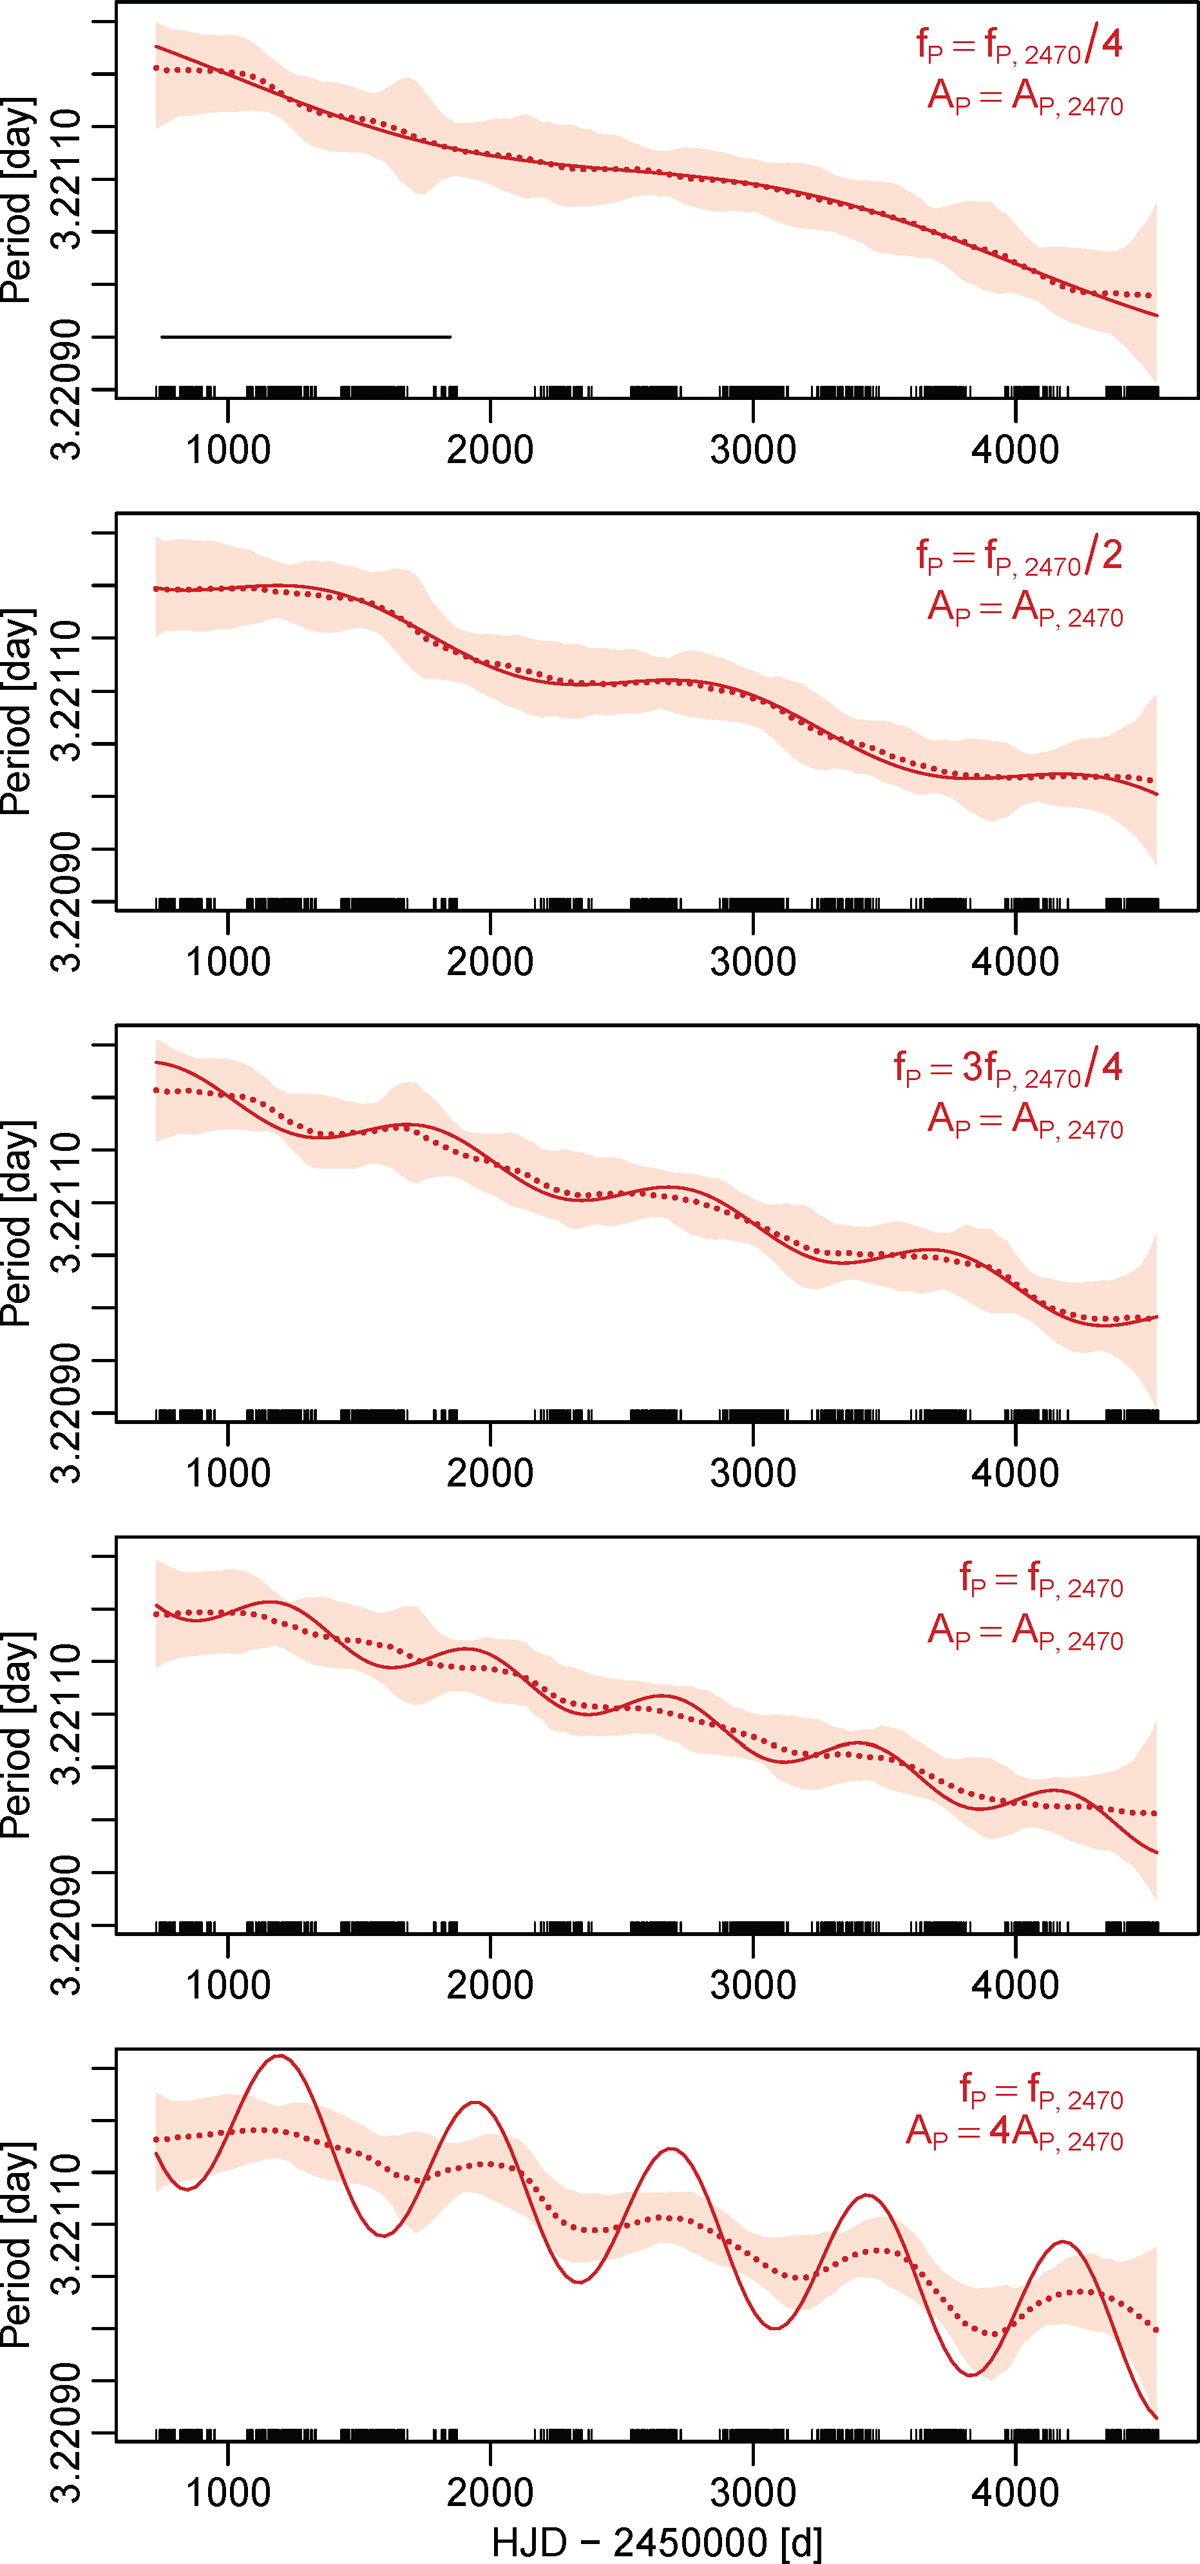
Simulated oscillations of the period, superposed to the period trend estimated for CEP-2470. The parameters of the simulated modulations are shown in the upper right corner of the panels. The true simulated modulations of the period are shown with solid red lines. The 0.025, 0.975 quantiles and the median of the kernel estimates are indicated by the colored band and the dotted thick line, similarly to Fig. B.1. The thin black horizontal line in the top panel shows the full width of the sliding window, to ease comparison with the period of the fluctuations. The rugplot added to the x-axis indicates the observation times.
Current usage metrics show cumulative count of Article Views (full-text article views including HTML views, PDF and ePub downloads, according to the available data) and Abstracts Views on Vision4Press platform.
Data correspond to usage on the plateform after 2015. The current usage metrics is available 48-96 hours after online publication and is updated daily on week days.
Initial download of the metrics may take a while.