Fig. B.1
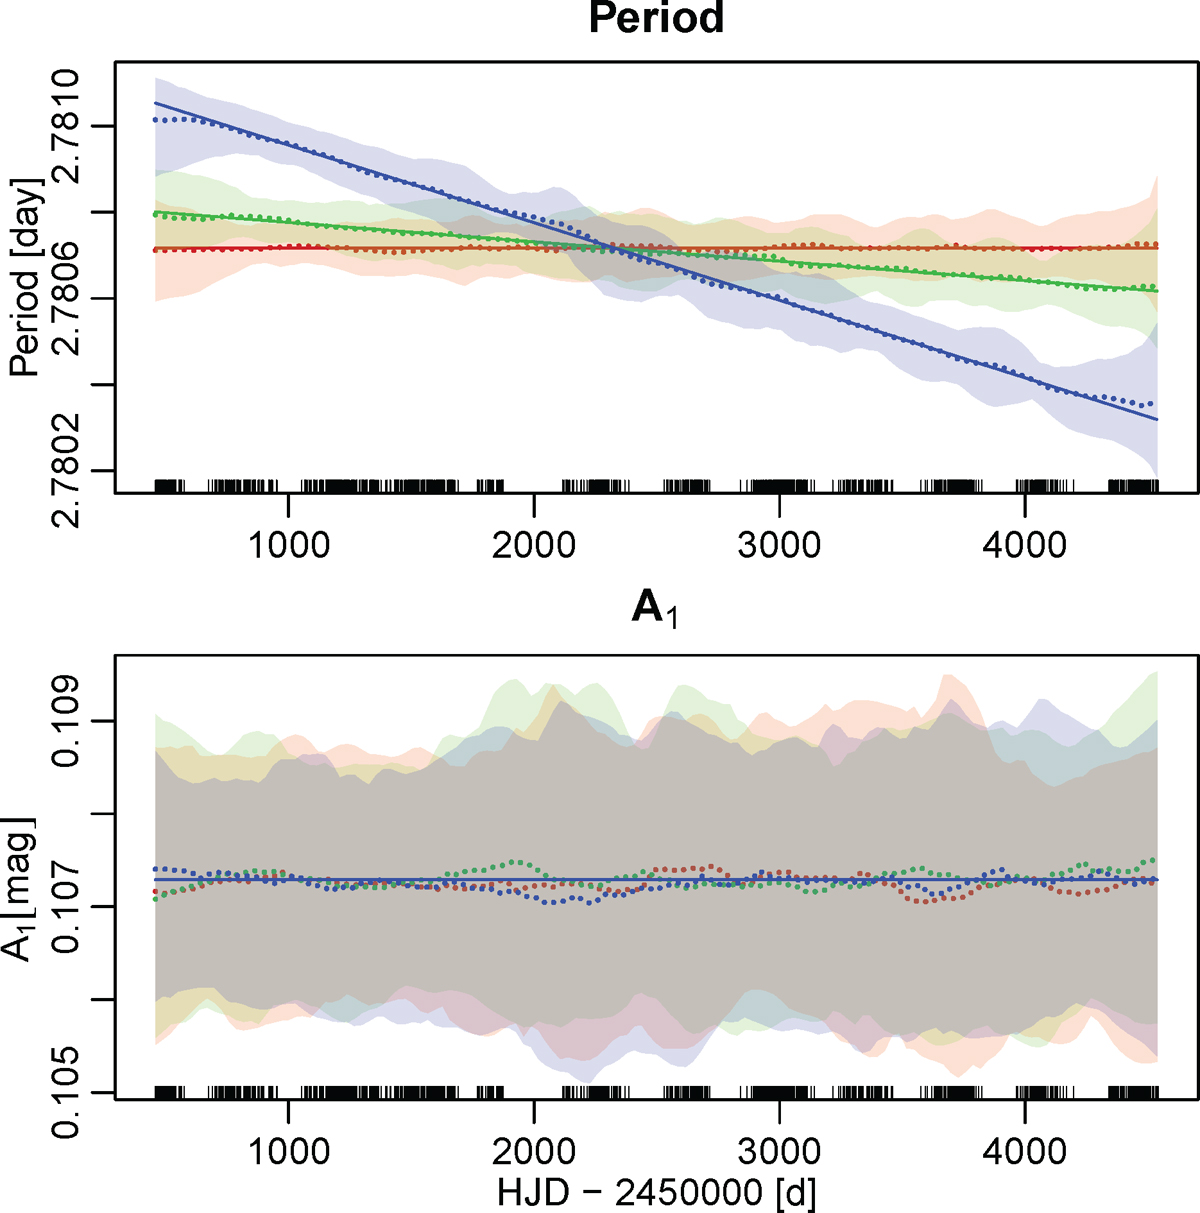
Simulated trends in pulsation period (top panel) combined with a constant amplitude (bottom panel) as estimated by the localkernel method. Thin red, green and blue solid lines in the top panel: the simulated values using slopes 0, 0.25 and 1 times that of OGLE-LMC-CEP-1405 (such that the blue line coincides with the trend component found for this Cepheid). The true amplitude, which had the same constant value in all simulations, is represented by a blue line in the bottom panel. Dotted red, green and blue lines: the pointwise median of the kernel estimates on the 250 repetitions. The colors show a 95% symmetric confidence band around the median.
Current usage metrics show cumulative count of Article Views (full-text article views including HTML views, PDF and ePub downloads, according to the available data) and Abstracts Views on Vision4Press platform.
Data correspond to usage on the plateform after 2015. The current usage metrics is available 48-96 hours after online publication and is updated daily on week days.
Initial download of the metrics may take a while.