Fig. A.1
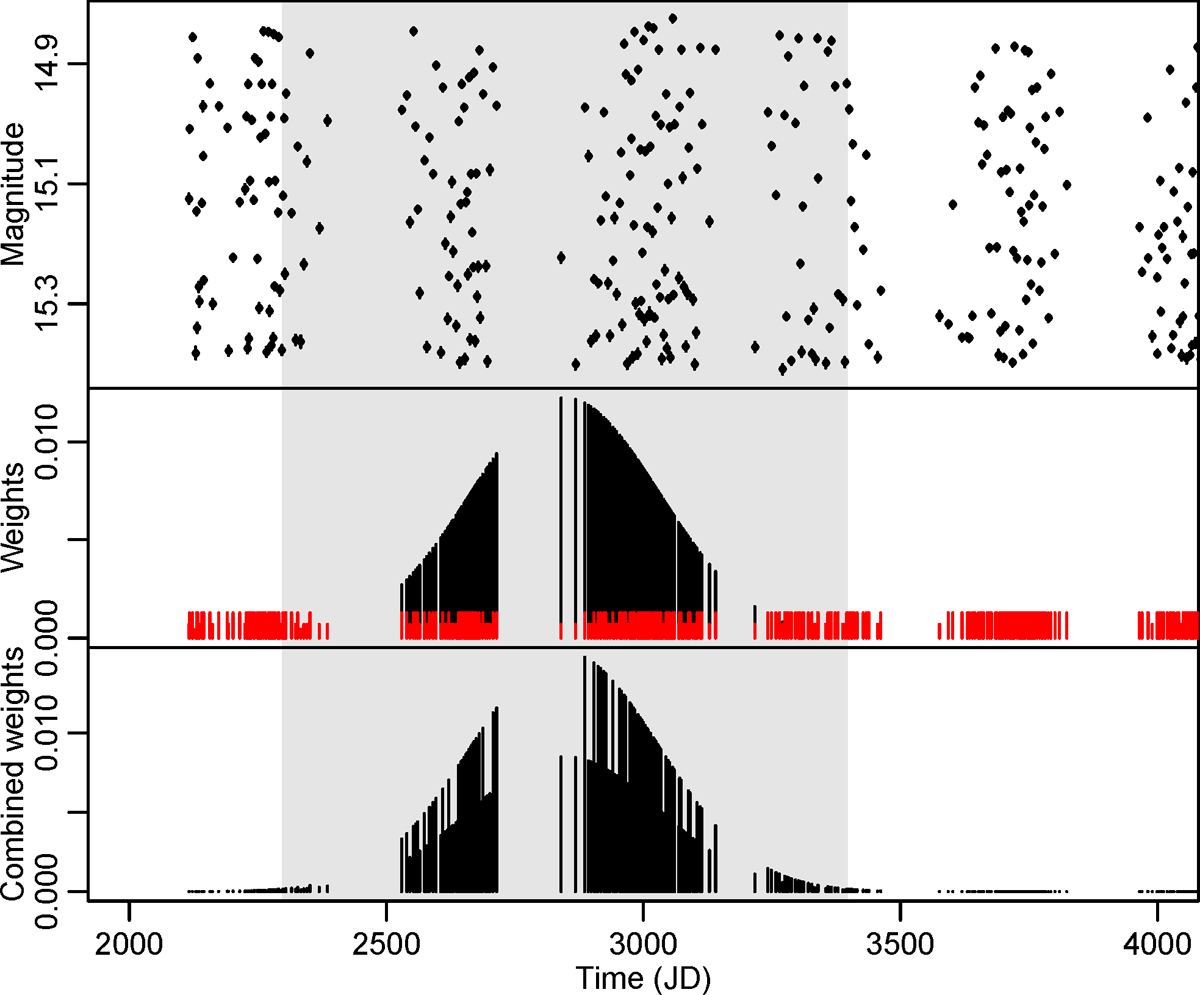
Weighting scheme. The top panel shows a portion of the observed time series of OGLE-LMC-CEP-1621, with the fitted window highlighted by a gray background. The middle panel shows the two weight sequences: in black, the kernel weights, in red, the inverse error weights. The bottom panel exhibits the combined weights used in the fit.
Current usage metrics show cumulative count of Article Views (full-text article views including HTML views, PDF and ePub downloads, according to the available data) and Abstracts Views on Vision4Press platform.
Data correspond to usage on the plateform after 2015. The current usage metrics is available 48-96 hours after online publication and is updated daily on week days.
Initial download of the metrics may take a while.