Fig. 10
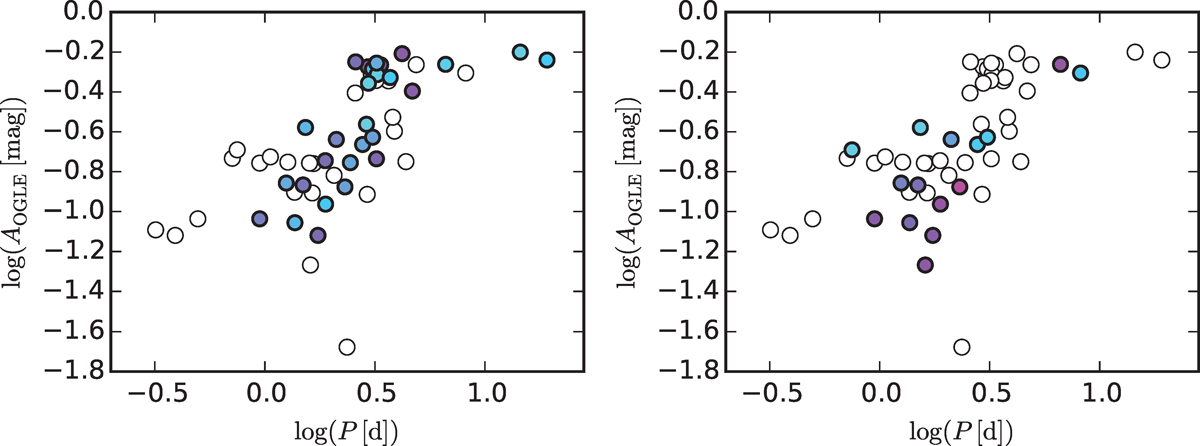
Double-logarithmic period-amplitude diagram for program Cepheids using the original OGLE-III periods and peak-to-peak amplitudes. Constant objects are shown as open circles, variable objects as filled circles. Left panel: changing periods. The color corresponds to column TP of Tables 1 and 2, from cyan (0%) to magenta (100%). Right panel: variable amplitudes. The color corresponds to column ![]() of Tables 1 and 2, from cyan (0%) to magenta (100%).
of Tables 1 and 2, from cyan (0%) to magenta (100%).
Current usage metrics show cumulative count of Article Views (full-text article views including HTML views, PDF and ePub downloads, according to the available data) and Abstracts Views on Vision4Press platform.
Data correspond to usage on the plateform after 2015. The current usage metrics is available 48-96 hours after online publication and is updated daily on week days.
Initial download of the metrics may take a while.