Fig. 1
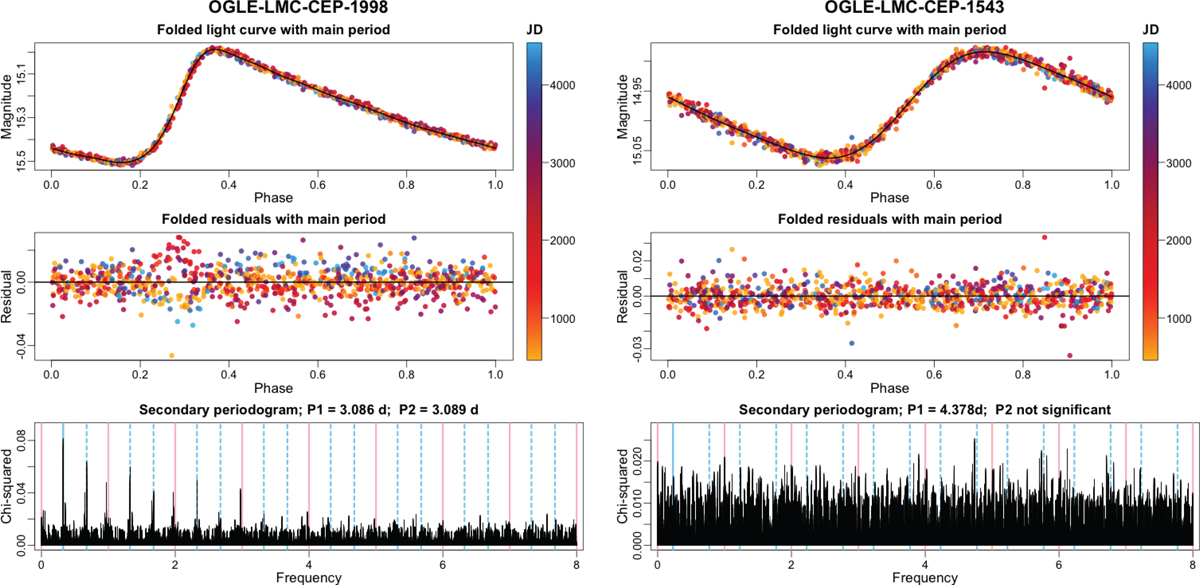
Left: CEP-1998 as an example of a twin-peak target, for which secondary periods are found after pre-whitening the light curve using the primary period. Right: CEP-1543 as an example from the control group (no twin peaks). Colors trace observation date, increasing from yellow to blue. Top panels: phase-folded (with primary period) OGLE-III I-band light curve. Center panels: residuals after subtracting Fourier series model. Bottom panels: periodogram of the residuals shown in the center panel. Pink vertical lines at 0, 1, … d−1 indicate parasite frequencies due to residual trends in the time series. The solid light blue vertical line indicates the OGLE catalog (primary) frequency. The dashed light blue lines correspond to its ± 1, 2, … aliases.
Current usage metrics show cumulative count of Article Views (full-text article views including HTML views, PDF and ePub downloads, according to the available data) and Abstracts Views on Vision4Press platform.
Data correspond to usage on the plateform after 2015. The current usage metrics is available 48-96 hours after online publication and is updated daily on week days.
Initial download of the metrics may take a while.