Free Access
Fig. 3
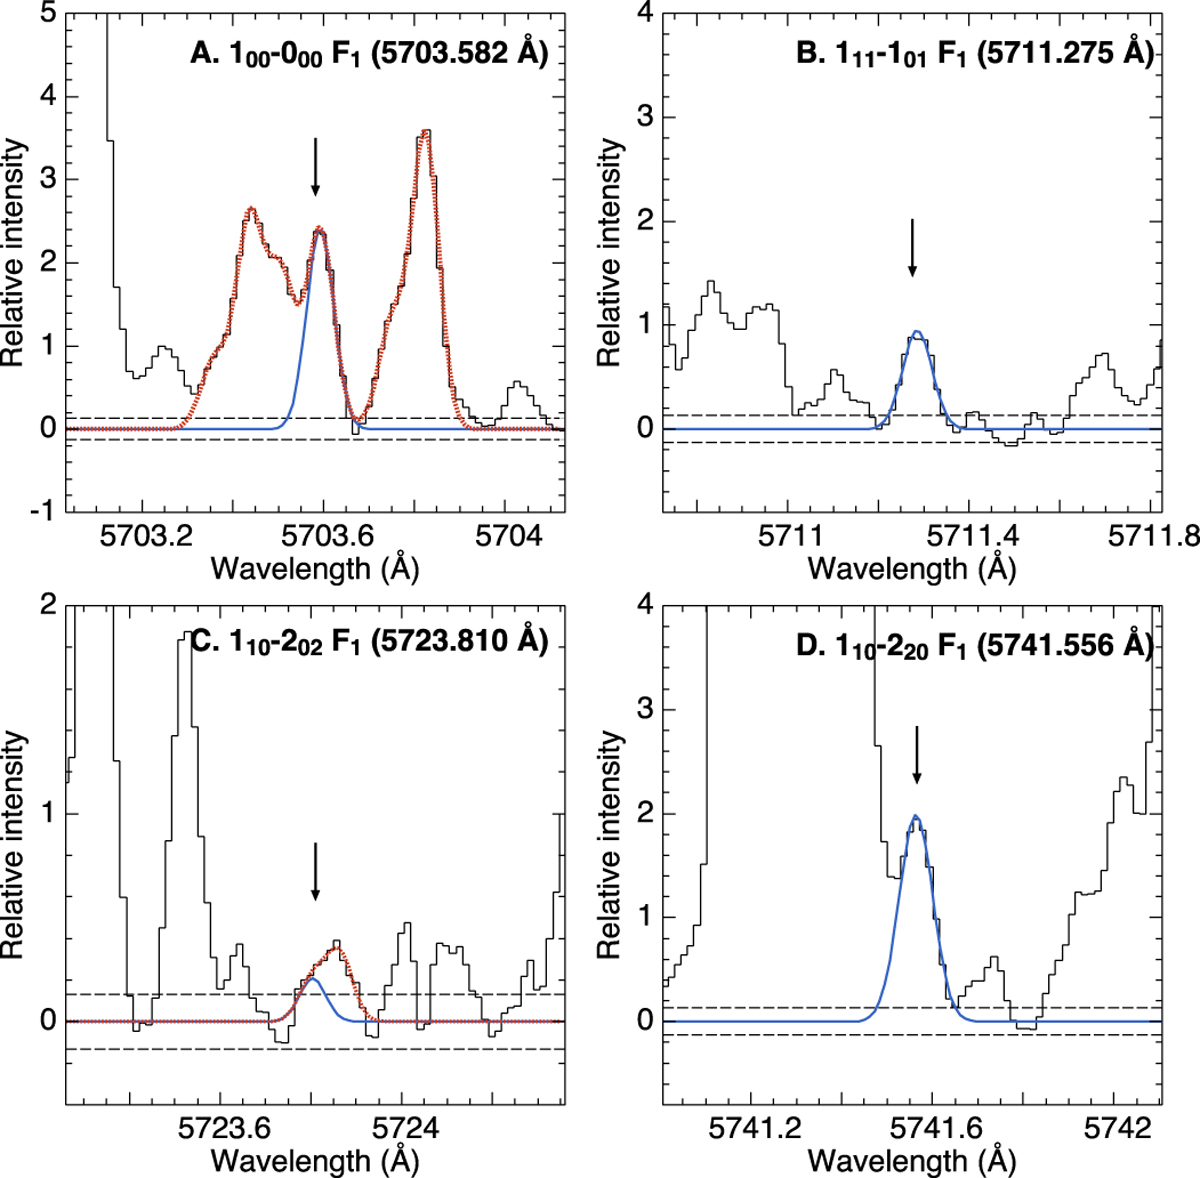
Four measured 15NH2 lines of comet C/2015 ER61. Blue solid lines and black arrows show the 15NH2 lines. Red dotted lines in panels A and C indicate the results of ad hoc fitting with multiple Gaussian functions. Gray dashed lines indicate the ±1σ error of the continuum levels.
Current usage metrics show cumulative count of Article Views (full-text article views including HTML views, PDF and ePub downloads, according to the available data) and Abstracts Views on Vision4Press platform.
Data correspond to usage on the plateform after 2015. The current usage metrics is available 48-96 hours after online publication and is updated daily on week days.
Initial download of the metrics may take a while.