Fig. 2
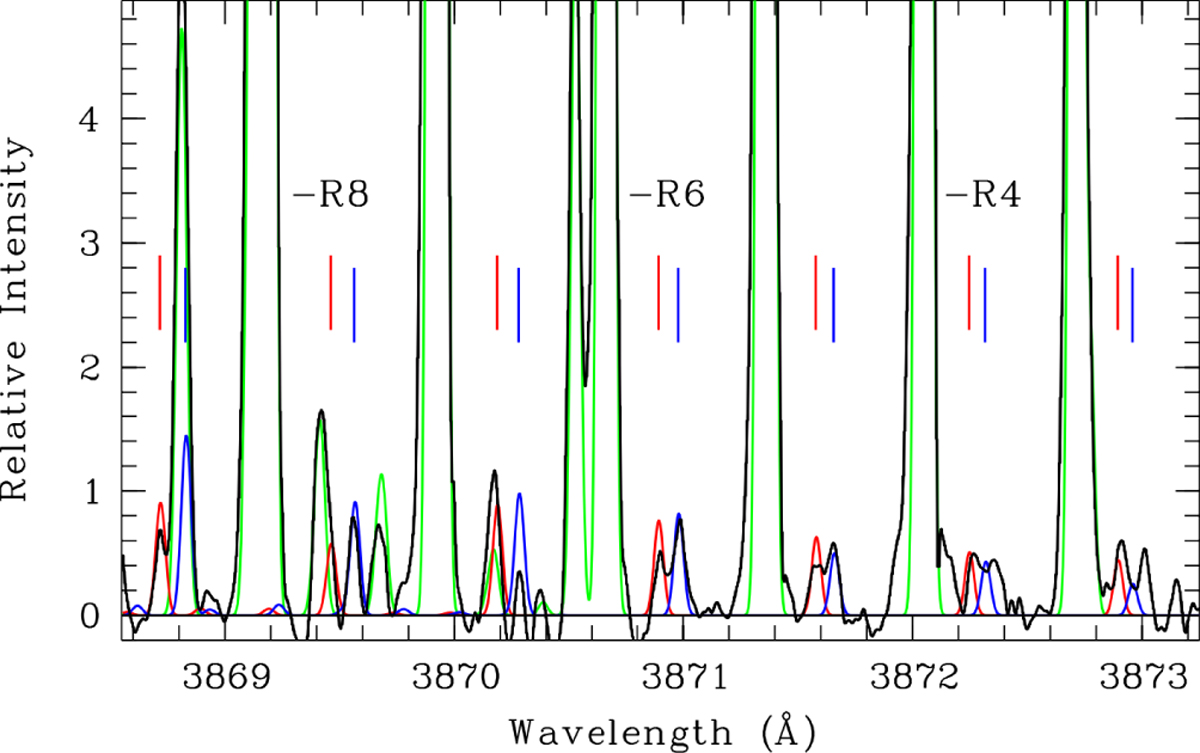
UVES spectra (black line) compared to synthetic spectra of isotopic species: 12C14N (green line), 12C15N (red line), and 13C14N (blue line). The synthetic spectra are computed with the adopted isotopic abundances. The lines of 12C15N and 13C14N are identified by the red ticks and the blue ticks, respectively, and a few R lines are indicated by their quantum number.
Current usage metrics show cumulative count of Article Views (full-text article views including HTML views, PDF and ePub downloads, according to the available data) and Abstracts Views on Vision4Press platform.
Data correspond to usage on the plateform after 2015. The current usage metrics is available 48-96 hours after online publication and is updated daily on week days.
Initial download of the metrics may take a while.