Fig. 1
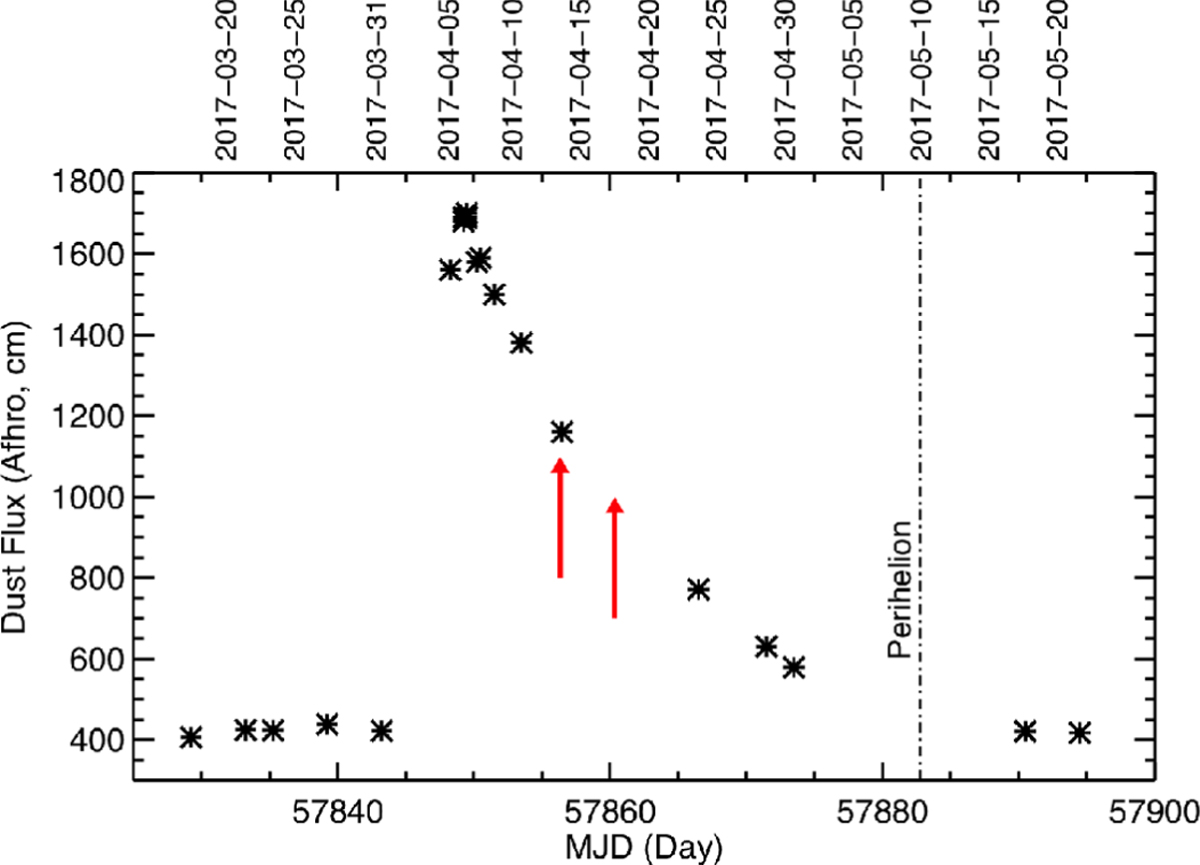
Pre- and post-outburst evolution of the brightness of comet C/2015 ER61. The stars are the Afρ values we measured using I-band images obtained with the TRAPPIST-South telescope. The Afρ value is a proxy for the dust production rate (A’Hearn et al. 1984). The two red arrows indicate the dates (UT 2017 April 13 and 17) of the UVES observations, which were just one week after the outburst. The vertical dashed line indicates the time when the comet reached its perihelion.
Current usage metrics show cumulative count of Article Views (full-text article views including HTML views, PDF and ePub downloads, according to the available data) and Abstracts Views on Vision4Press platform.
Data correspond to usage on the plateform after 2015. The current usage metrics is available 48-96 hours after online publication and is updated daily on week days.
Initial download of the metrics may take a while.