Fig. 9
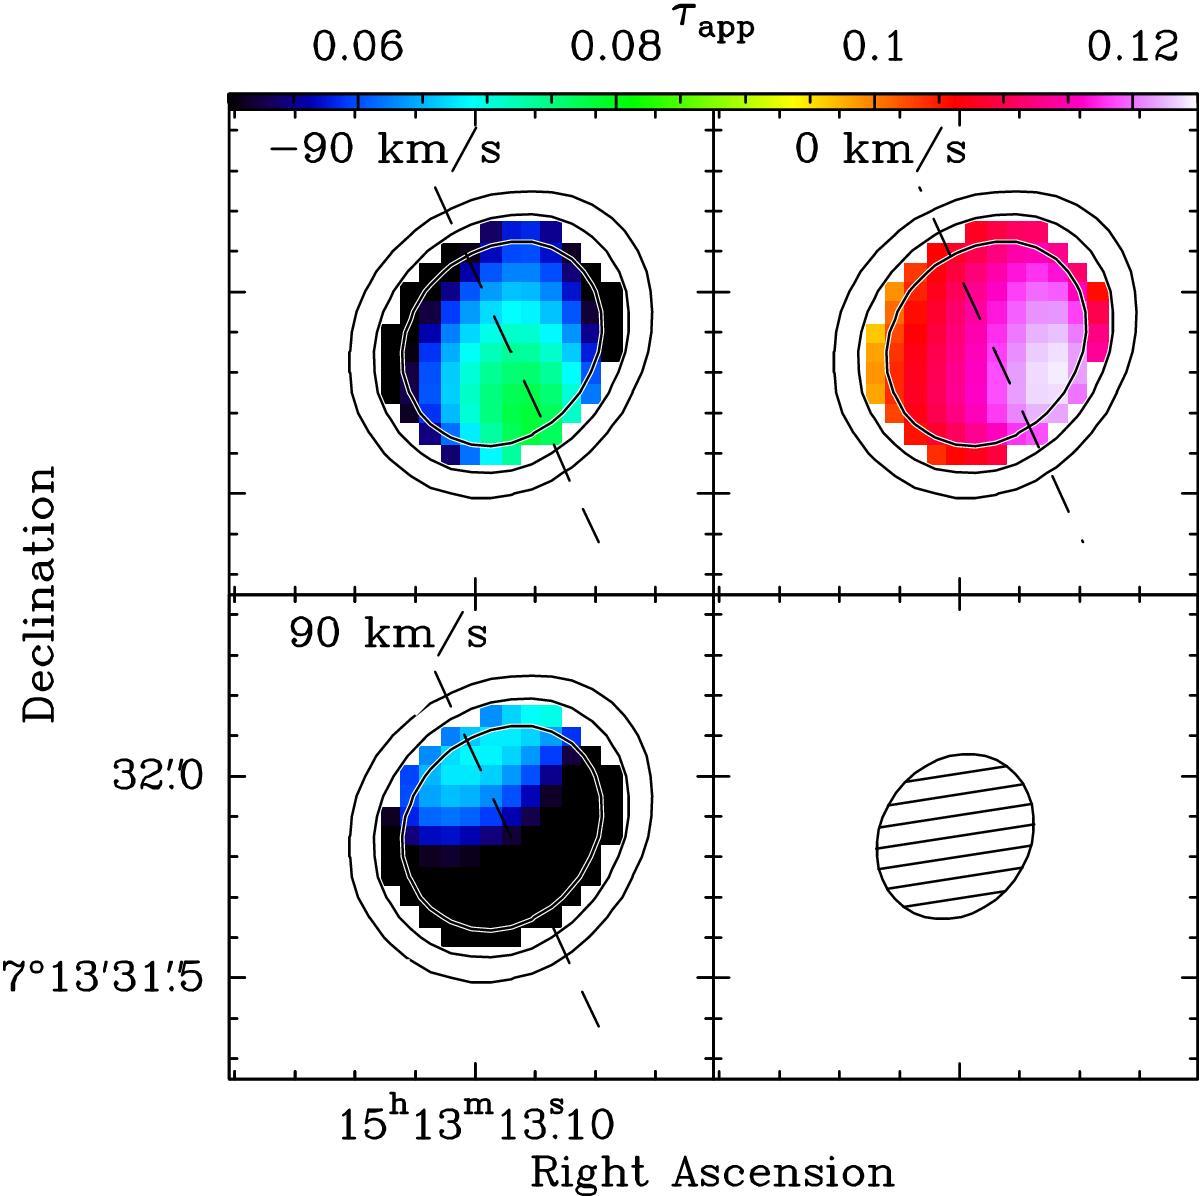
Channel maps of the apparent optical depth in the OH 4751 MHz line. Channels have been averaged together in groups of five to produce bins of width 90 km s-1. The three highest contours from the continuum map in Fig. 2 are included for reference. The dashed line in the first three panels indicates the major axis of the extended radio continuum structure. The lower right panel shows the fitted beam.
Current usage metrics show cumulative count of Article Views (full-text article views including HTML views, PDF and ePub downloads, according to the available data) and Abstracts Views on Vision4Press platform.
Data correspond to usage on the plateform after 2015. The current usage metrics is available 48-96 hours after online publication and is updated daily on week days.
Initial download of the metrics may take a while.