Fig. 7
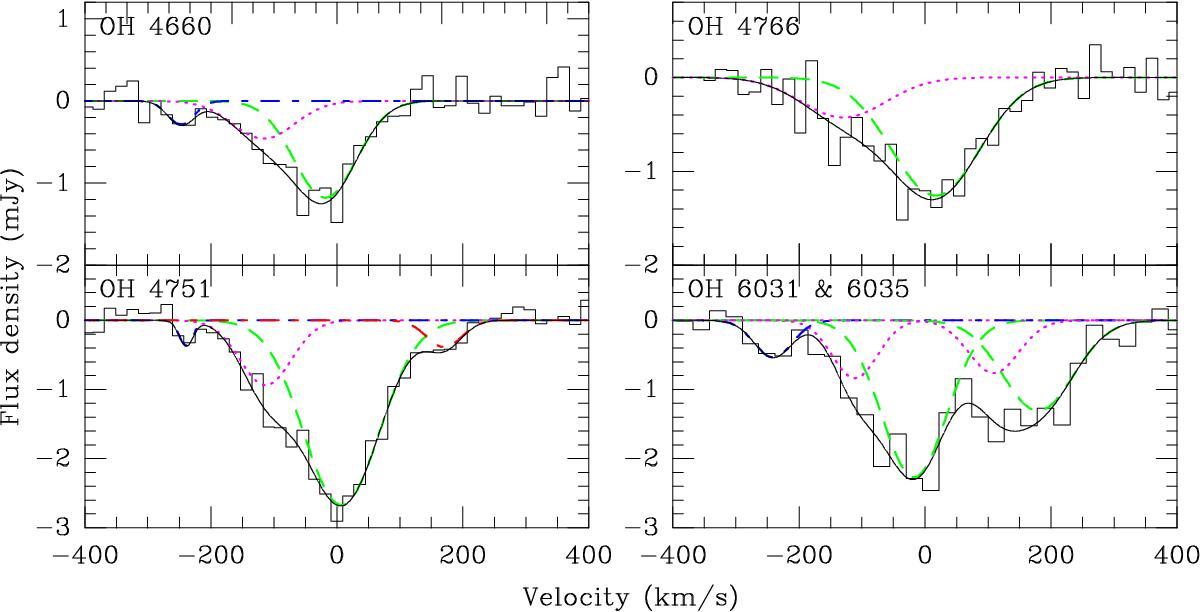
Detected OH absorption lines. The measured global spectra are plotted as histograms. The green dashed lines are Gaussian fits to the main feature in each spectrum. The magenta dotted lines are fits to the ~−110 km s-1 feature, except in the upper right spectrum where this component cannot be distinguished from the blueshifted line wing. The dashed-dotted blue (in all but the upper right panel) and red (in the lower left panel) lines are fits to the blue- and redshifted line wings, respectively. The black solid lines are the total fits. The velocity scale for the 6 GHz lines is centered at the 6035 MHz line and the rest velocity of the 6031 MHz line is at ~ 215 km s-1. All spectra are referenced to the barycentric reference frame using z = 0.012999.
Current usage metrics show cumulative count of Article Views (full-text article views including HTML views, PDF and ePub downloads, according to the available data) and Abstracts Views on Vision4Press platform.
Data correspond to usage on the plateform after 2015. The current usage metrics is available 48-96 hours after online publication and is updated daily on week days.
Initial download of the metrics may take a while.