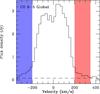
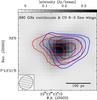
Fig. 6

Top: integrated spectrum of CO J = 6–5 with the spectral regions used to make the figure in the bottom panel marked. A dashed line in the spectrum indicates the 1σ level of the noise above zero intensity. The spectrum is referenced to the barycentric reference frame using z = 0.012999. Bottom: integrated intensity maps over the channels marked in the spectrum from the top panel overlaid on the 690 GHz continuum grayscale image. Contours are given at 1,2,4,8 × 3σ for the wing emission. The fitted beam (0.22″ × 0.20″, PA ~ −35°) is shown in the lower left corner.
Current usage metrics show cumulative count of Article Views (full-text article views including HTML views, PDF and ePub downloads, according to the available data) and Abstracts Views on Vision4Press platform.
Data correspond to usage on the plateform after 2015. The current usage metrics is available 48-96 hours after online publication and is updated daily on week days.
Initial download of the metrics may take a while.