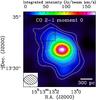
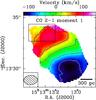
Fig. 4
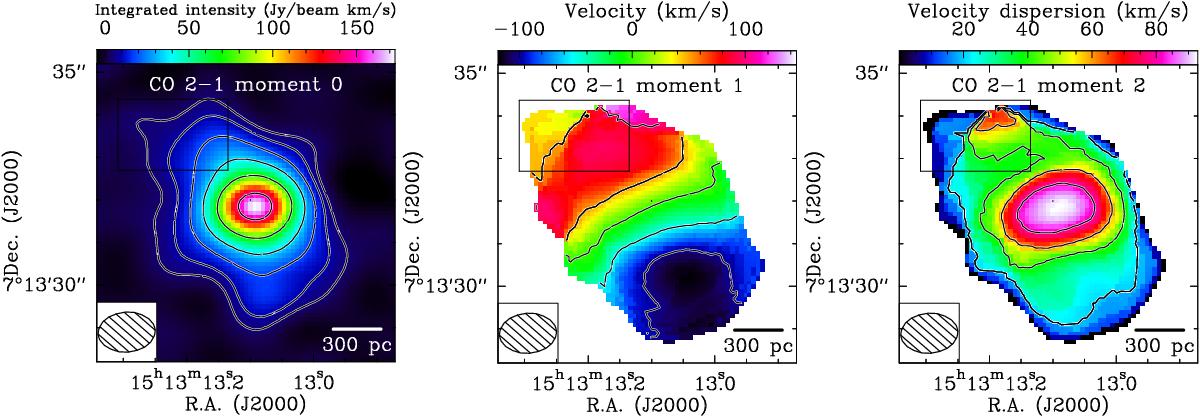
Moment maps of CO J = 2–1. Left: integrated intensity map with contours at 1,2,4,8,16,32 × 4.5 Jy beam-1 km s-1. Center: mean velocity map with contours at −100,−50,0,50,100 km s-1. Right: dispersion map with contours at 20,40,60,80 km s-1. The small box in each of the maps indicate the location of an extra emission component close to the systemic velocity. The fitted beam (1.34″ × 0.94″, PA ~ −86°) is shown in the lower left corner of each panel.
Current usage metrics show cumulative count of Article Views (full-text article views including HTML views, PDF and ePub downloads, according to the available data) and Abstracts Views on Vision4Press platform.
Data correspond to usage on the plateform after 2015. The current usage metrics is available 48-96 hours after online publication and is updated daily on week days.
Initial download of the metrics may take a while.