Fig. 3
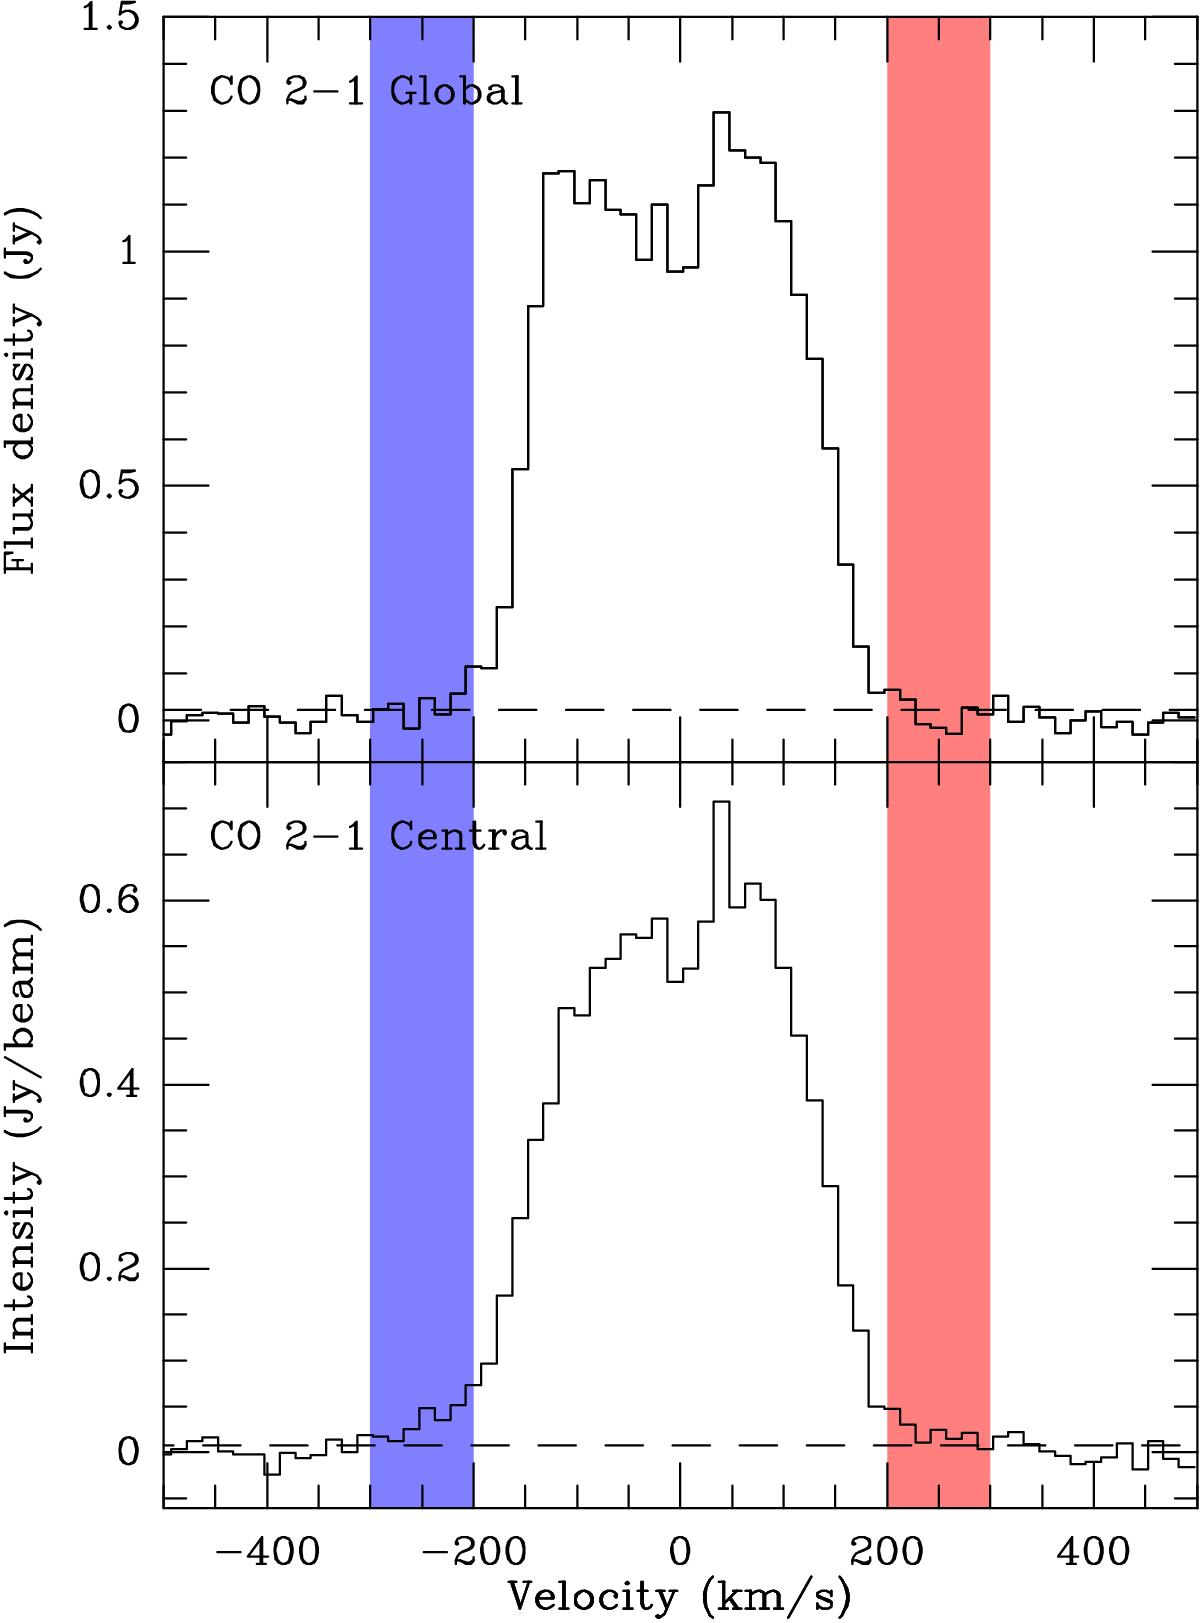
Spectra of CO J = 2–1 in Zw 049.057. Top: integrated over the region with emission stronger than 3σ in the integrated intensity map. Bottom: extracted from the peak of the integrated intensity map. The shaded regions indicate the velocity intervals of the blue- and red-shifted line wings seen in the lower spectrum. A dashed line in each spectrum indicates the 1σ level of the noise above zero intensity. The spectra are referenced to the barycentric reference frame using z = 0.012999.
Current usage metrics show cumulative count of Article Views (full-text article views including HTML views, PDF and ePub downloads, according to the available data) and Abstracts Views on Vision4Press platform.
Data correspond to usage on the plateform after 2015. The current usage metrics is available 48-96 hours after online publication and is updated daily on week days.
Initial download of the metrics may take a while.