Fig. 1
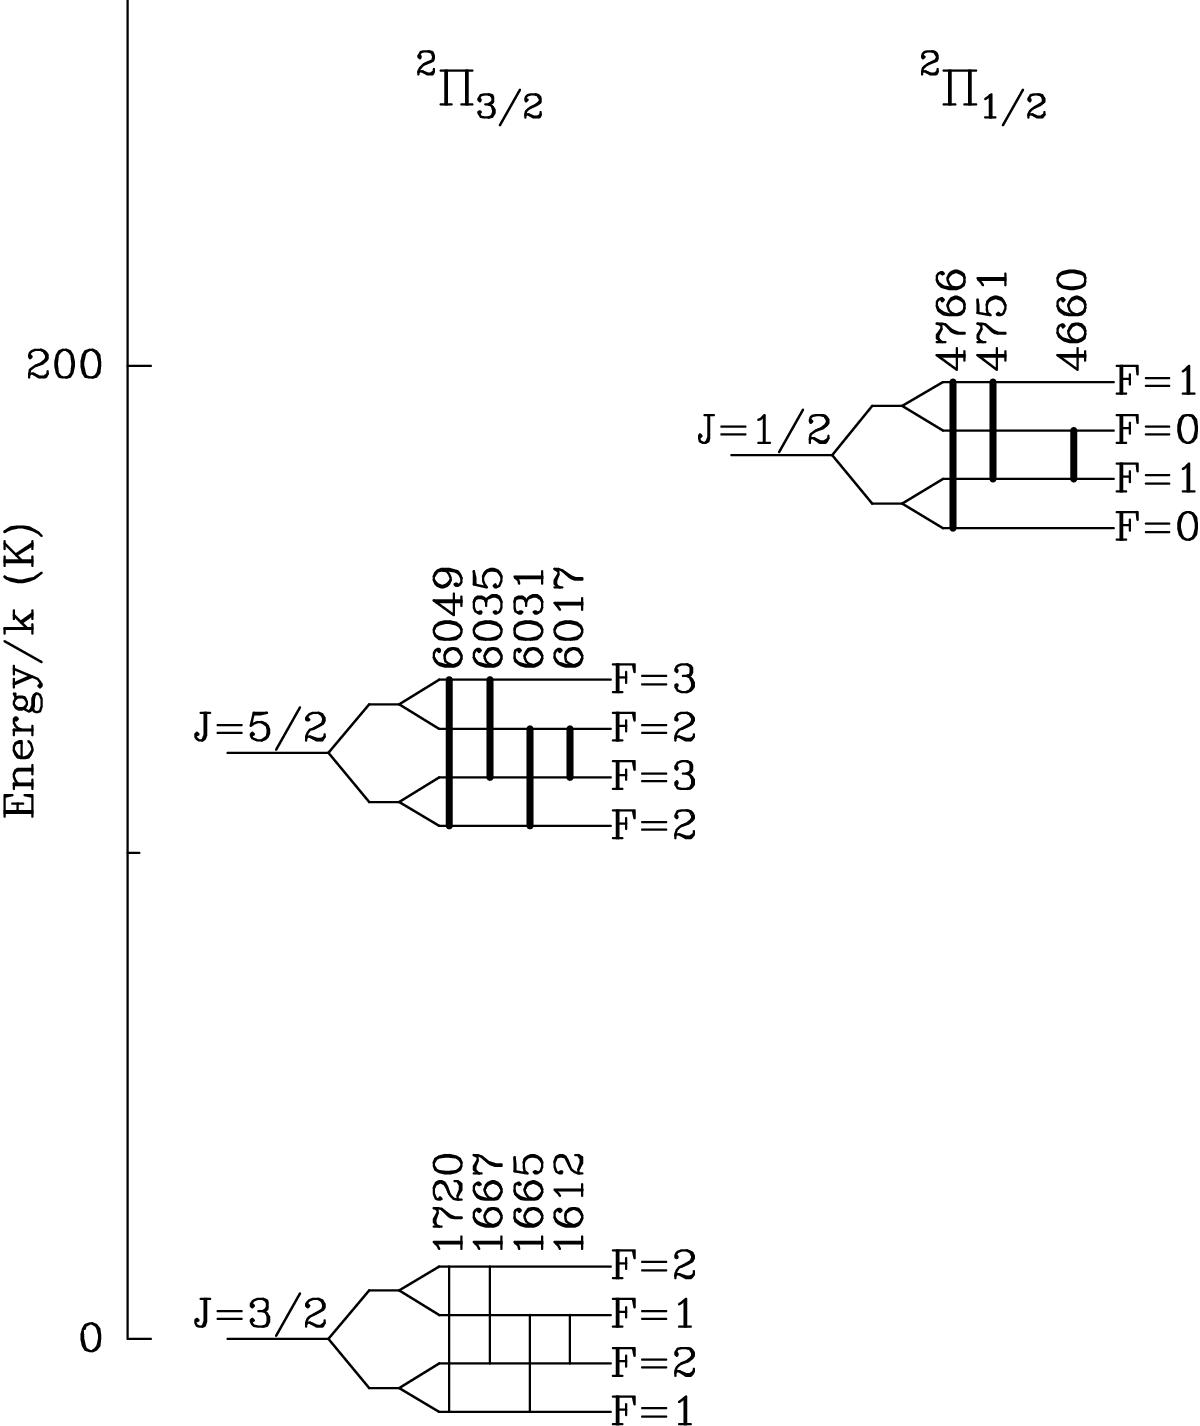
Energy diagram showing the ground and two first excited rotational states of OH. The Λ-doubling and hyperfine levels are not to scale. Transitions between hyperfine levels are indicated with lines connecting the levels in question and their frequencies in MHz are shown above the lines. Transitions observed in this paper are indicated with boldface lines.
Current usage metrics show cumulative count of Article Views (full-text article views including HTML views, PDF and ePub downloads, according to the available data) and Abstracts Views on Vision4Press platform.
Data correspond to usage on the plateform after 2015. The current usage metrics is available 48-96 hours after online publication and is updated daily on week days.
Initial download of the metrics may take a while.