Free Access
Fig. A.1
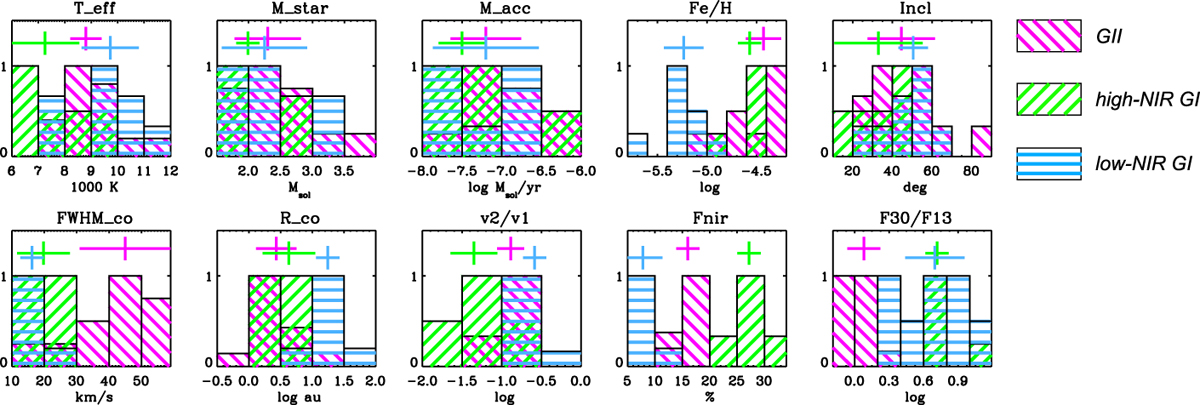
Histograms of normalized distributions of the sample parameters included in Table A.1. Median values and median absolute deviations for each category are plotted at the top of each histogram. GII disks are shown in magenta, high-NIR GI disks in green, and low-NIR GI disks in cyan.
Current usage metrics show cumulative count of Article Views (full-text article views including HTML views, PDF and ePub downloads, according to the available data) and Abstracts Views on Vision4Press platform.
Data correspond to usage on the plateform after 2015. The current usage metrics is available 48-96 hours after online publication and is updated daily on week days.
Initial download of the metrics may take a while.