Fig. 1
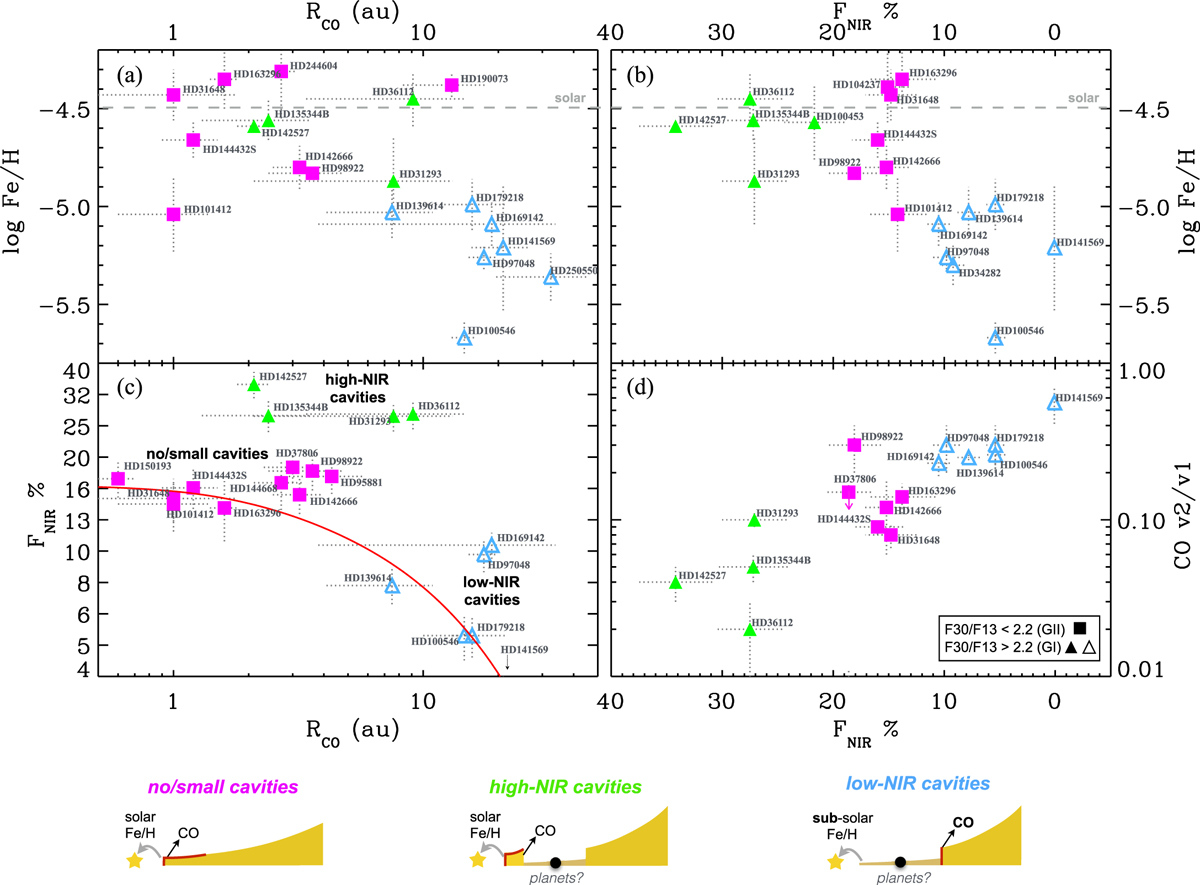
Linked behavior between the datasets combined in this work. a) Fe/H vs Rco. b) Fe/H vs FNIR. c) FNIR vs Rco. d) v2/v1 vs FNIR. The red curve shows a parametric model of the decrease of FNIR with increasing size of an inner cavity (see text for details). The three disk categories identified in the multi-dimensional parameter space are illustrated to the bottom. Dust is shown in yellow, and we mark the approximate location of infrared CO emission. Dust depletion is shown as a thinner yellow layer of residual dust, and dust layers that dominate the observed FNIR are marked in red. GII disks are shown as magenta squares, high-NIR GI disks as green triangles, low-NIR GI disks as cyan (empty) triangles.
Current usage metrics show cumulative count of Article Views (full-text article views including HTML views, PDF and ePub downloads, according to the available data) and Abstracts Views on Vision4Press platform.
Data correspond to usage on the plateform after 2015. The current usage metrics is available 48-96 hours after online publication and is updated daily on week days.
Initial download of the metrics may take a while.