Fig. 9
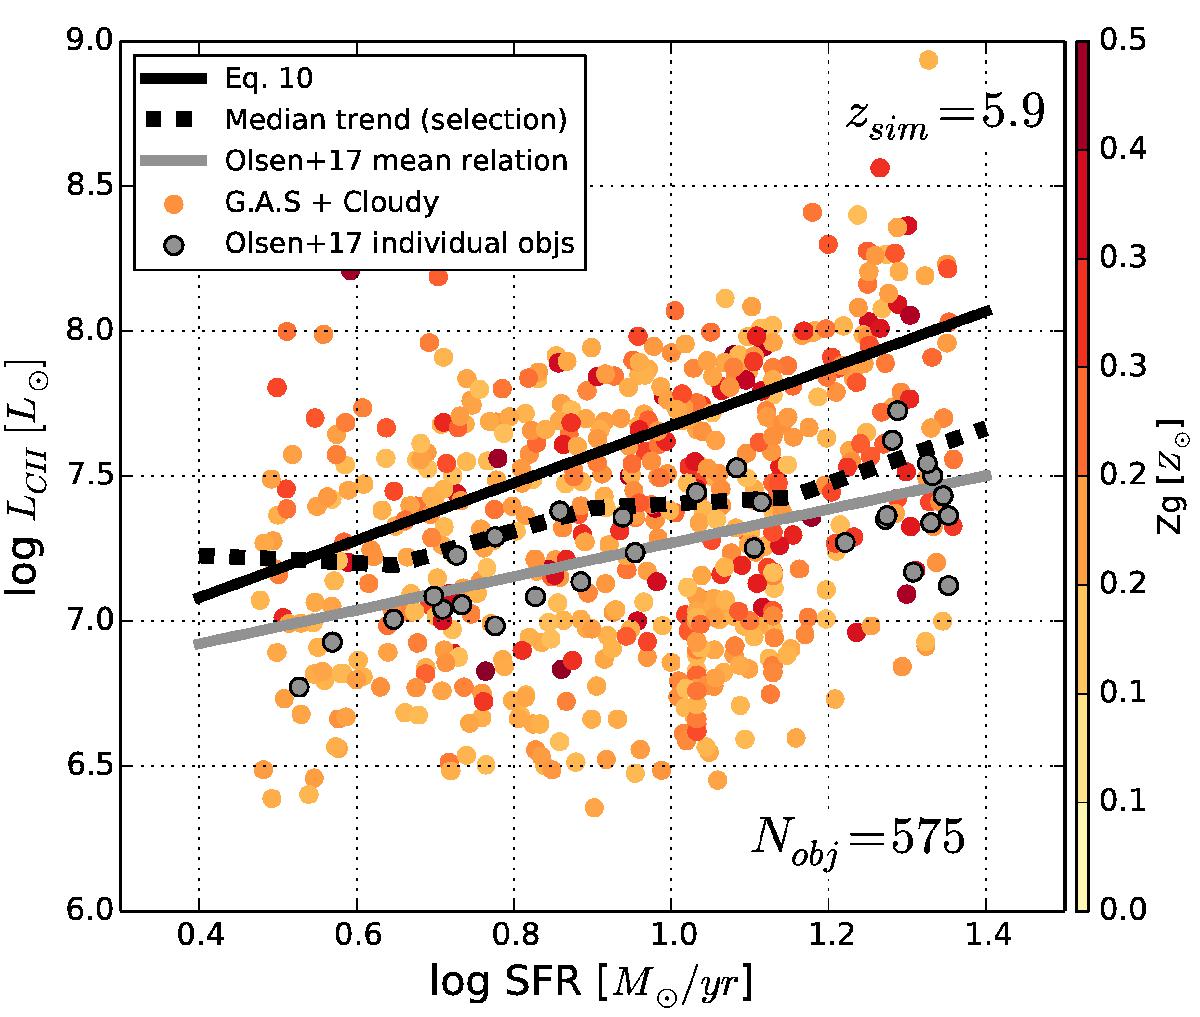
L[CII]–SFR relation for galaxies that follow the selection of the simulated galaxy sample by Olsen et al. (2017) at z ~ 6. Our 575 selected galaxies are shown with coloured points (with colour scale reflecting the gas metallicity). Olsen et al. (2017) sample is shown with grey points. The black and the grey solid lines show the mean trend of our whole galaxy sample (Eq. (10)) and of Olsen et al. (2017) sample (their Eq. (6)), respectively. The black dashed line marks the mean trend of our galaxy selection.
Current usage metrics show cumulative count of Article Views (full-text article views including HTML views, PDF and ePub downloads, according to the available data) and Abstracts Views on Vision4Press platform.
Data correspond to usage on the plateform after 2015. The current usage metrics is available 48-96 hours after online publication and is updated daily on week days.
Initial download of the metrics may take a while.