Fig. 7
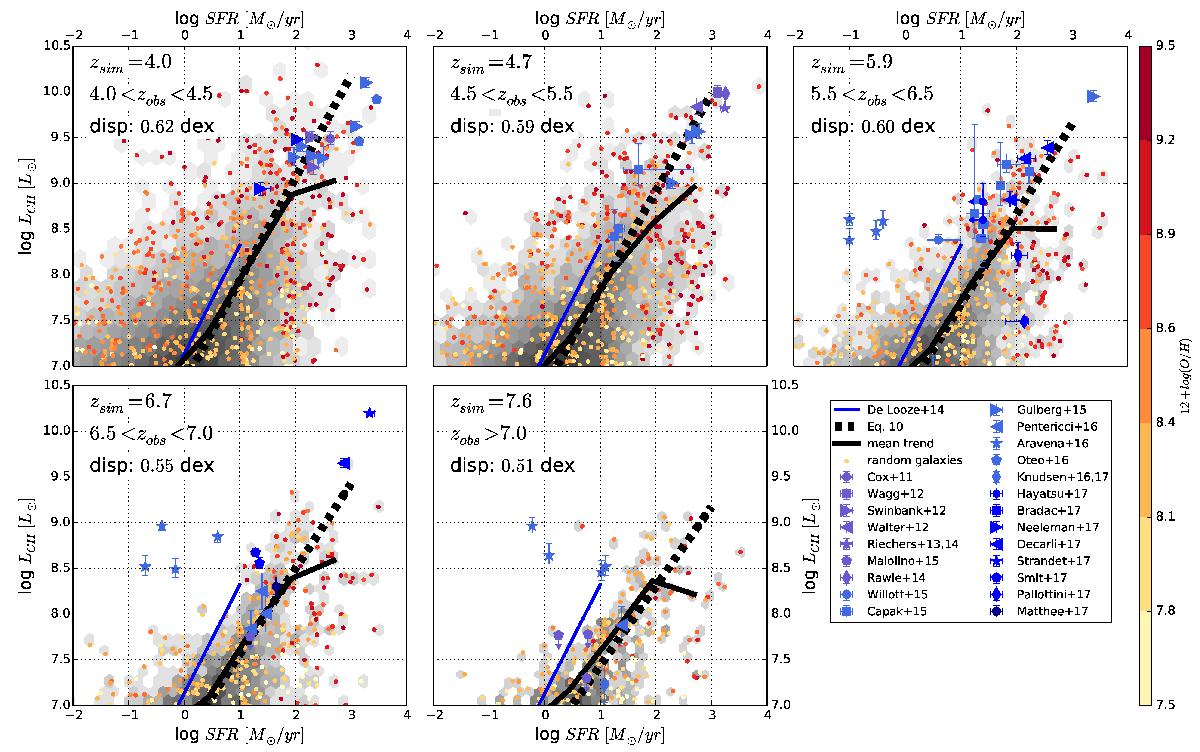
L[CII]–SFR relation. Predictions from our model are shown for a set of redshifts from z = 4 to z = 7.6. In each panel the whole sample of G.A.S. galaxies is shown in grey scale. The average relation is plotted with a solid black line. The black dashed line shows the relation given in Eq. (10). Yellow to red coloured points mark the gas metallicity of a randomly selected sample of simulated galaxies (note that the observed tendency of high-metallicity galaxies to fall either above or below the mean trend, that is to make an envelope, is only a trick of the eye caused by the plotting; galaxies with high metallicities (Zg> 8.8) are spread over the whole area, with a higher density of objects at high SFR). Our predictions are compared to a large sample of observational data that are detailed in Table B.1. Amplification corrections on luminosity and SFR, when available, are applied. For dusty star forming galaxies, SFR are converted directly from LIR using the Kennicutt (1998) conversion factor assuming a Chabrier (2003) IMF where SFR (M⊙ yr-1) = 1.0 × 10⁻¹⁰LIR(L⊙). The blue solid line shows the De Looze et al. (2014) relation for the local dwarf galaxy sample.
Current usage metrics show cumulative count of Article Views (full-text article views including HTML views, PDF and ePub downloads, according to the available data) and Abstracts Views on Vision4Press platform.
Data correspond to usage on the plateform after 2015. The current usage metrics is available 48-96 hours after online publication and is updated daily on week days.
Initial download of the metrics may take a while.