Fig. 15
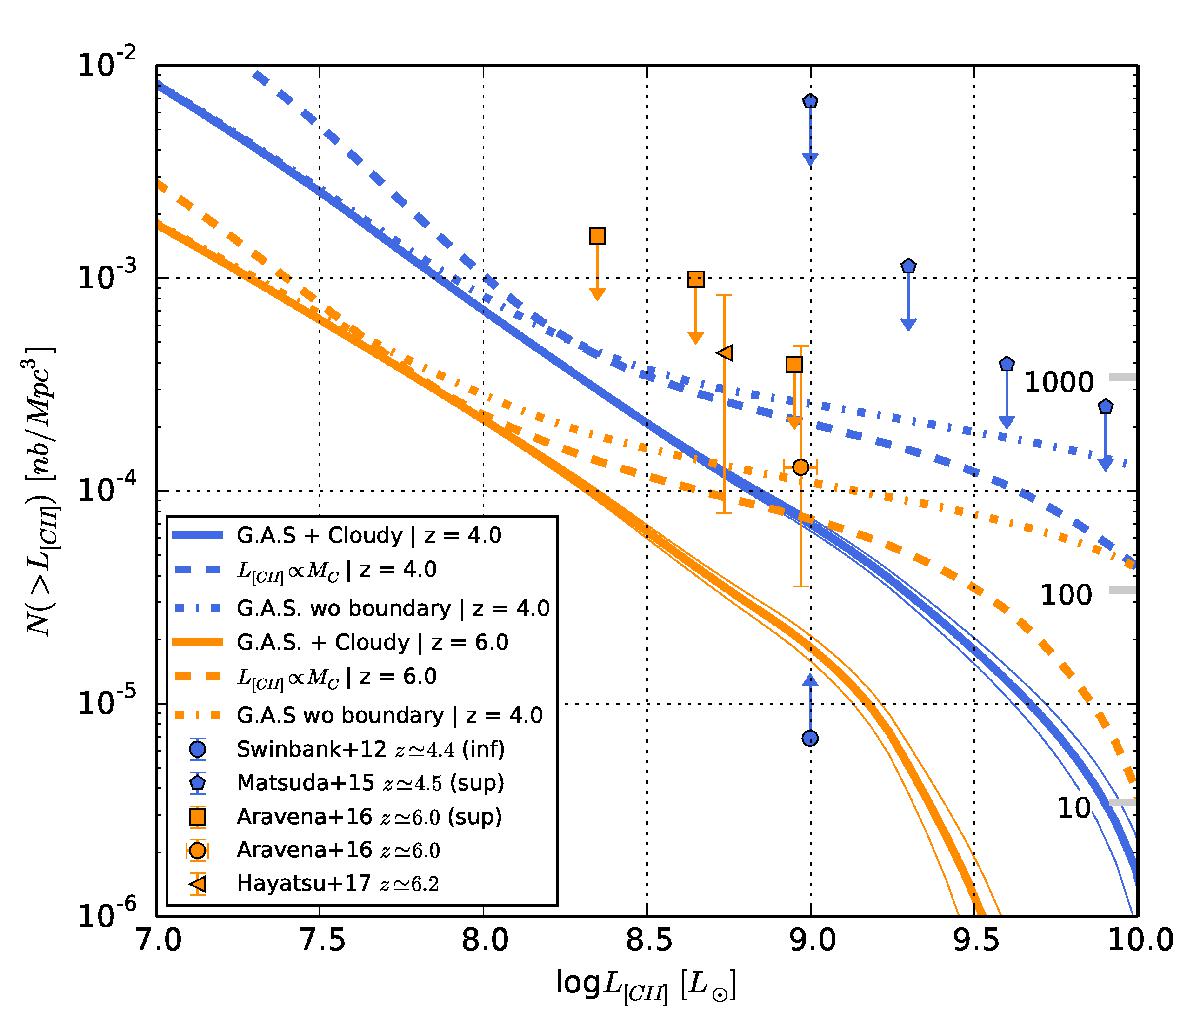
Cumulative [CII] luminosity functions predicted at z ≃ 4 and z ≃ 6 (thick continuous blue and orange lines, respectively, with the thin lines representing ![]() ), compared to the current observational constraints (data points with error bars). The dot-dashed lines are derived by relaxing the criterium req<rg which concerns only <0.8% of the galaxies. The dashed lines show the [CII] luminosity functions derived from the carbon mass function of our model.
), compared to the current observational constraints (data points with error bars). The dot-dashed lines are derived by relaxing the criterium req<rg which concerns only <0.8% of the galaxies. The dashed lines show the [CII] luminosity functions derived from the carbon mass function of our model.
Current usage metrics show cumulative count of Article Views (full-text article views including HTML views, PDF and ePub downloads, according to the available data) and Abstracts Views on Vision4Press platform.
Data correspond to usage on the plateform after 2015. The current usage metrics is available 48-96 hours after online publication and is updated daily on week days.
Initial download of the metrics may take a while.