Fig. 14
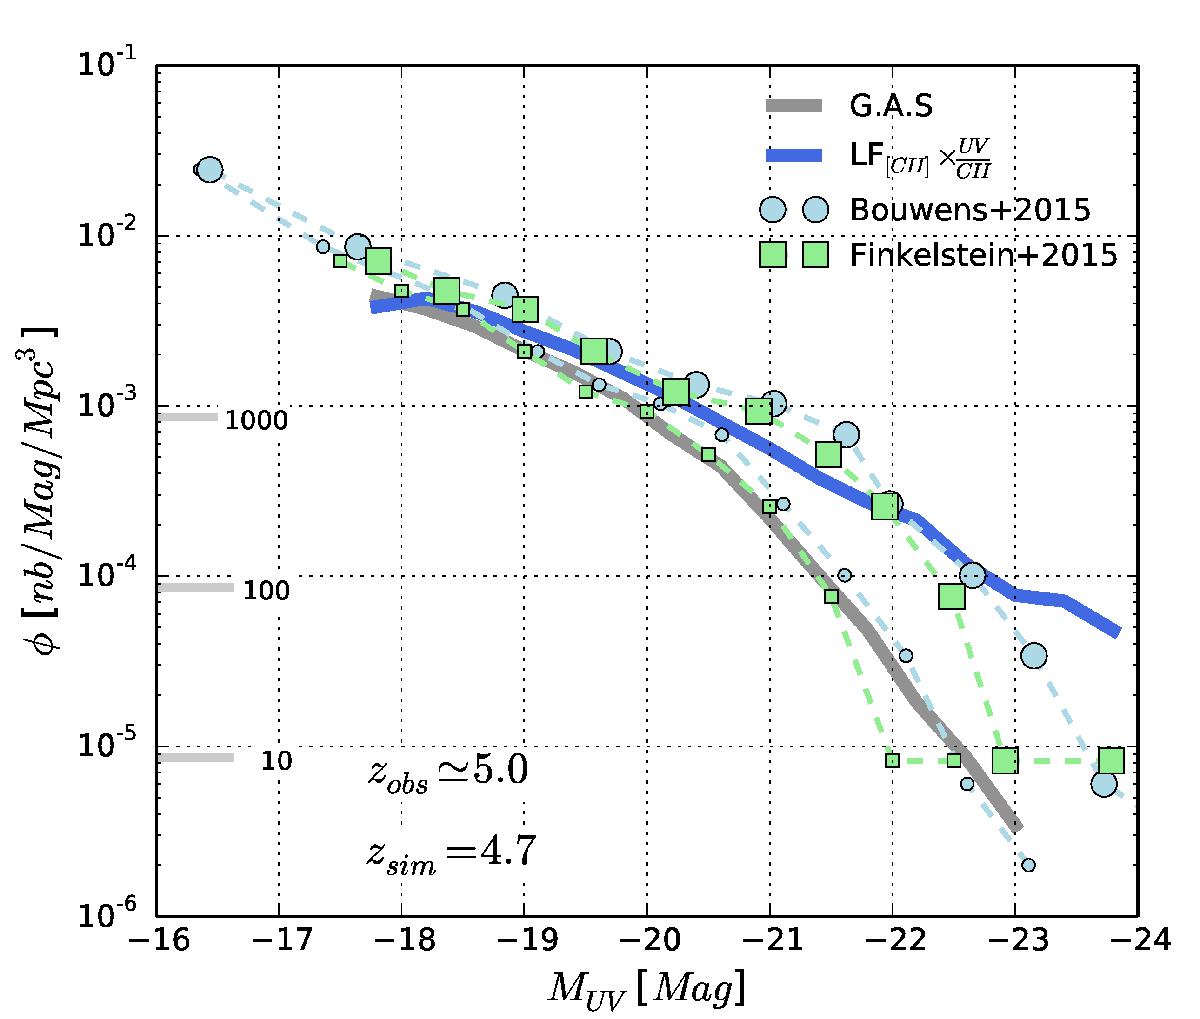
UV luminosity function derived from the [CII] luminosity function at z ~ 5. Small and large symbols are observational measurements without and with extinction correction, respectively. The correction of extinction of observed measurements has been done using G.A.S. (using the two grey cuves of Fig. 2). The solid grey line shows our predicted UV luminosity function from G.A.S., which is in good agreement with the observed data points coming from Bouwens et al. (2015) and Finkelstein et al. (2015). The UV luminosity function predicted from our [CII] luminosity function assuming a fixed [CII] to UV luminosity ratio is shown in blue.
Current usage metrics show cumulative count of Article Views (full-text article views including HTML views, PDF and ePub downloads, according to the available data) and Abstracts Views on Vision4Press platform.
Data correspond to usage on the plateform after 2015. The current usage metrics is available 48-96 hours after online publication and is updated daily on week days.
Initial download of the metrics may take a while.