Fig. 13
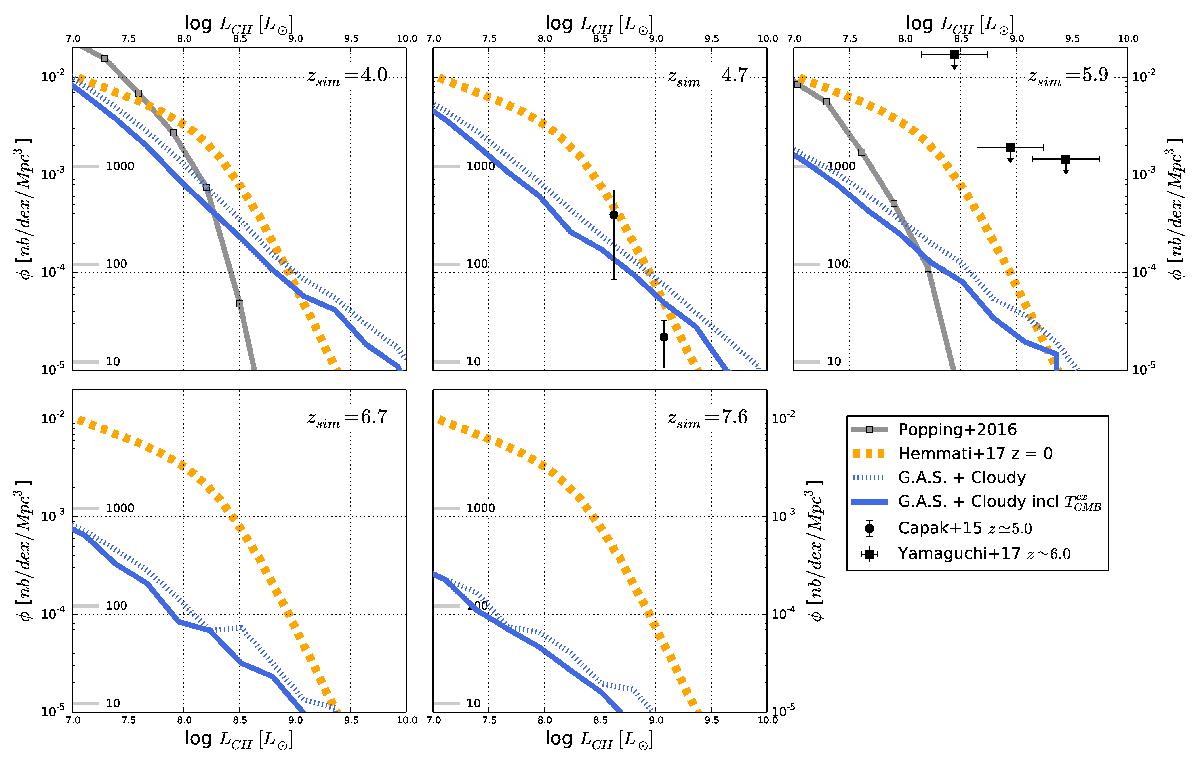
[CII] luminosity function predicted by the G.A.S.+CLOUDY model from z = 4.0 to z = 7.6. The blue solid curve shows the prediction that accounts for the attenuation of [CII] emission due to the CMB. The blue dotted line would be the luminosity function ignoring the attenuation. At z ≃ 5, we show the observational constraints from Capak et al. (2015). At z ≃ 6, the black squares indicate the observational results of Yamaguchi et al. (2017). We also add the local [CII] luminosity function published by Hemmati et al. (2017; orange dotted line) and model predictions of Popping et al. (2016; grey solid line).
Current usage metrics show cumulative count of Article Views (full-text article views including HTML views, PDF and ePub downloads, according to the available data) and Abstracts Views on Vision4Press platform.
Data correspond to usage on the plateform after 2015. The current usage metrics is available 48-96 hours after online publication and is updated daily on week days.
Initial download of the metrics may take a while.