Fig. 8
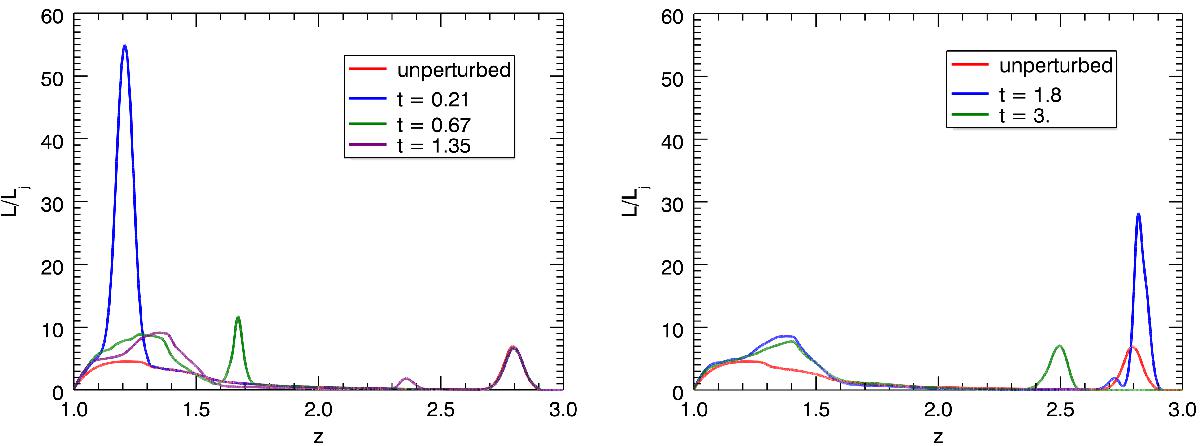
Profiles (integrated in planes normal to the jet axis) along the jet axis of the observed emissivity calculated for different times during the propagation of the perturbation. In both panels the red lines display the unperturbed profile. The left panel shows the profile a short time after the injection, while in the right panel we report the profiles at later times.
Current usage metrics show cumulative count of Article Views (full-text article views including HTML views, PDF and ePub downloads, according to the available data) and Abstracts Views on Vision4Press platform.
Data correspond to usage on the plateform after 2015. The current usage metrics is available 48-96 hours after online publication and is updated daily on week days.
Initial download of the metrics may take a while.