Fig. 7
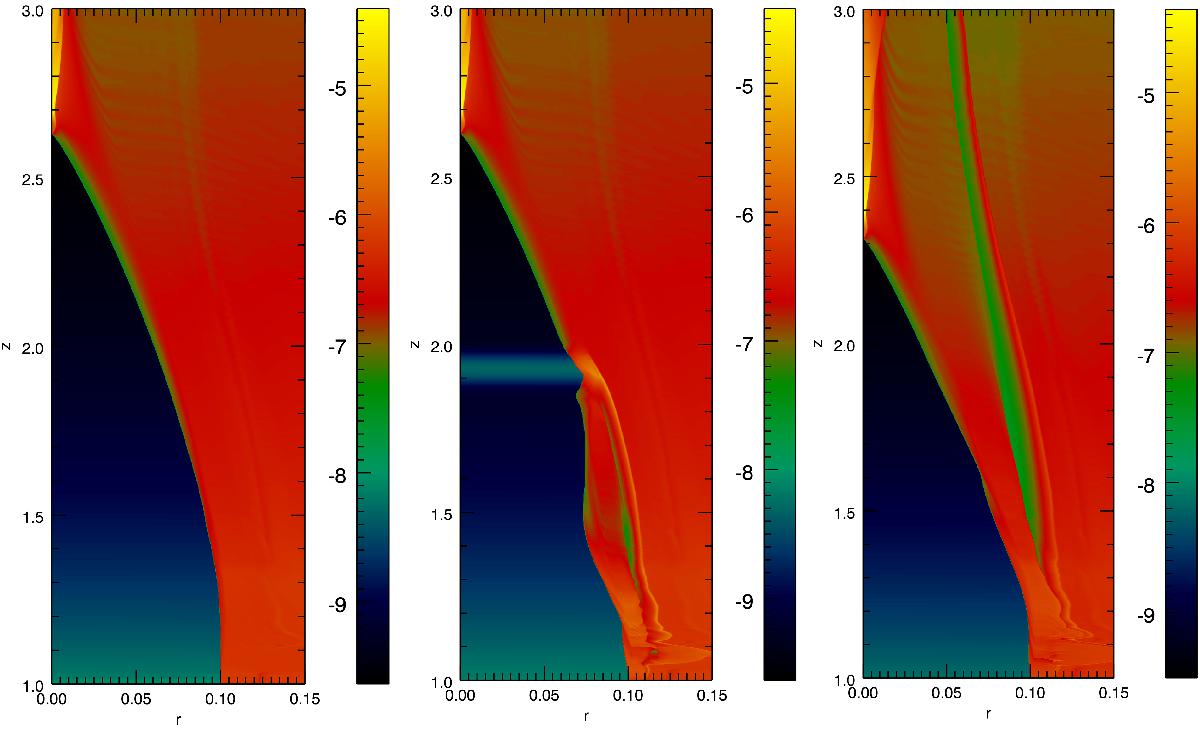
Pressure distribution (logarithmic scale) for the simulation including a propagating density perturbation. The three panels show the pressure in the stationary (equilibrium) state, after a time t = 0.9z0/c and, on the left, at t = 5z0/c. The figure clearly shows the high-pressure wake induced by the perturbation in the jet. In the last panel, the inward shift of the recollimation nozzle is clearly visible.
Current usage metrics show cumulative count of Article Views (full-text article views including HTML views, PDF and ePub downloads, according to the available data) and Abstracts Views on Vision4Press platform.
Data correspond to usage on the plateform after 2015. The current usage metrics is available 48-96 hours after online publication and is updated daily on week days.
Initial download of the metrics may take a while.