Fig. 4

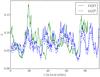
Evolution of ![]() as a function of time for runs located on different parts of the S-curve: (top panel) 434P is a cold branch run, 468P a non-convective hot branch run, and (bottom panel) 442 a convective hot branch run. For the latter we show the simulation run with outflow (442O) and periodic boundary conditions (442P). We also plot, for run 442O, the contribution of the Maxwell stress to
as a function of time for runs located on different parts of the S-curve: (top panel) 434P is a cold branch run, 468P a non-convective hot branch run, and (bottom panel) 442 a convective hot branch run. For the latter we show the simulation run with outflow (442O) and periodic boundary conditions (442P). We also plot, for run 442O, the contribution of the Maxwell stress to ![]() as a dashed line.
as a dashed line.

Current usage metrics show cumulative count of Article Views (full-text article views including HTML views, PDF and ePub downloads, according to the available data) and Abstracts Views on Vision4Press platform.
Data correspond to usage on the plateform after 2015. The current usage metrics is available 48-96 hours after online publication and is updated daily on week days.
Initial download of the metrics may take a while.