Fig. 3
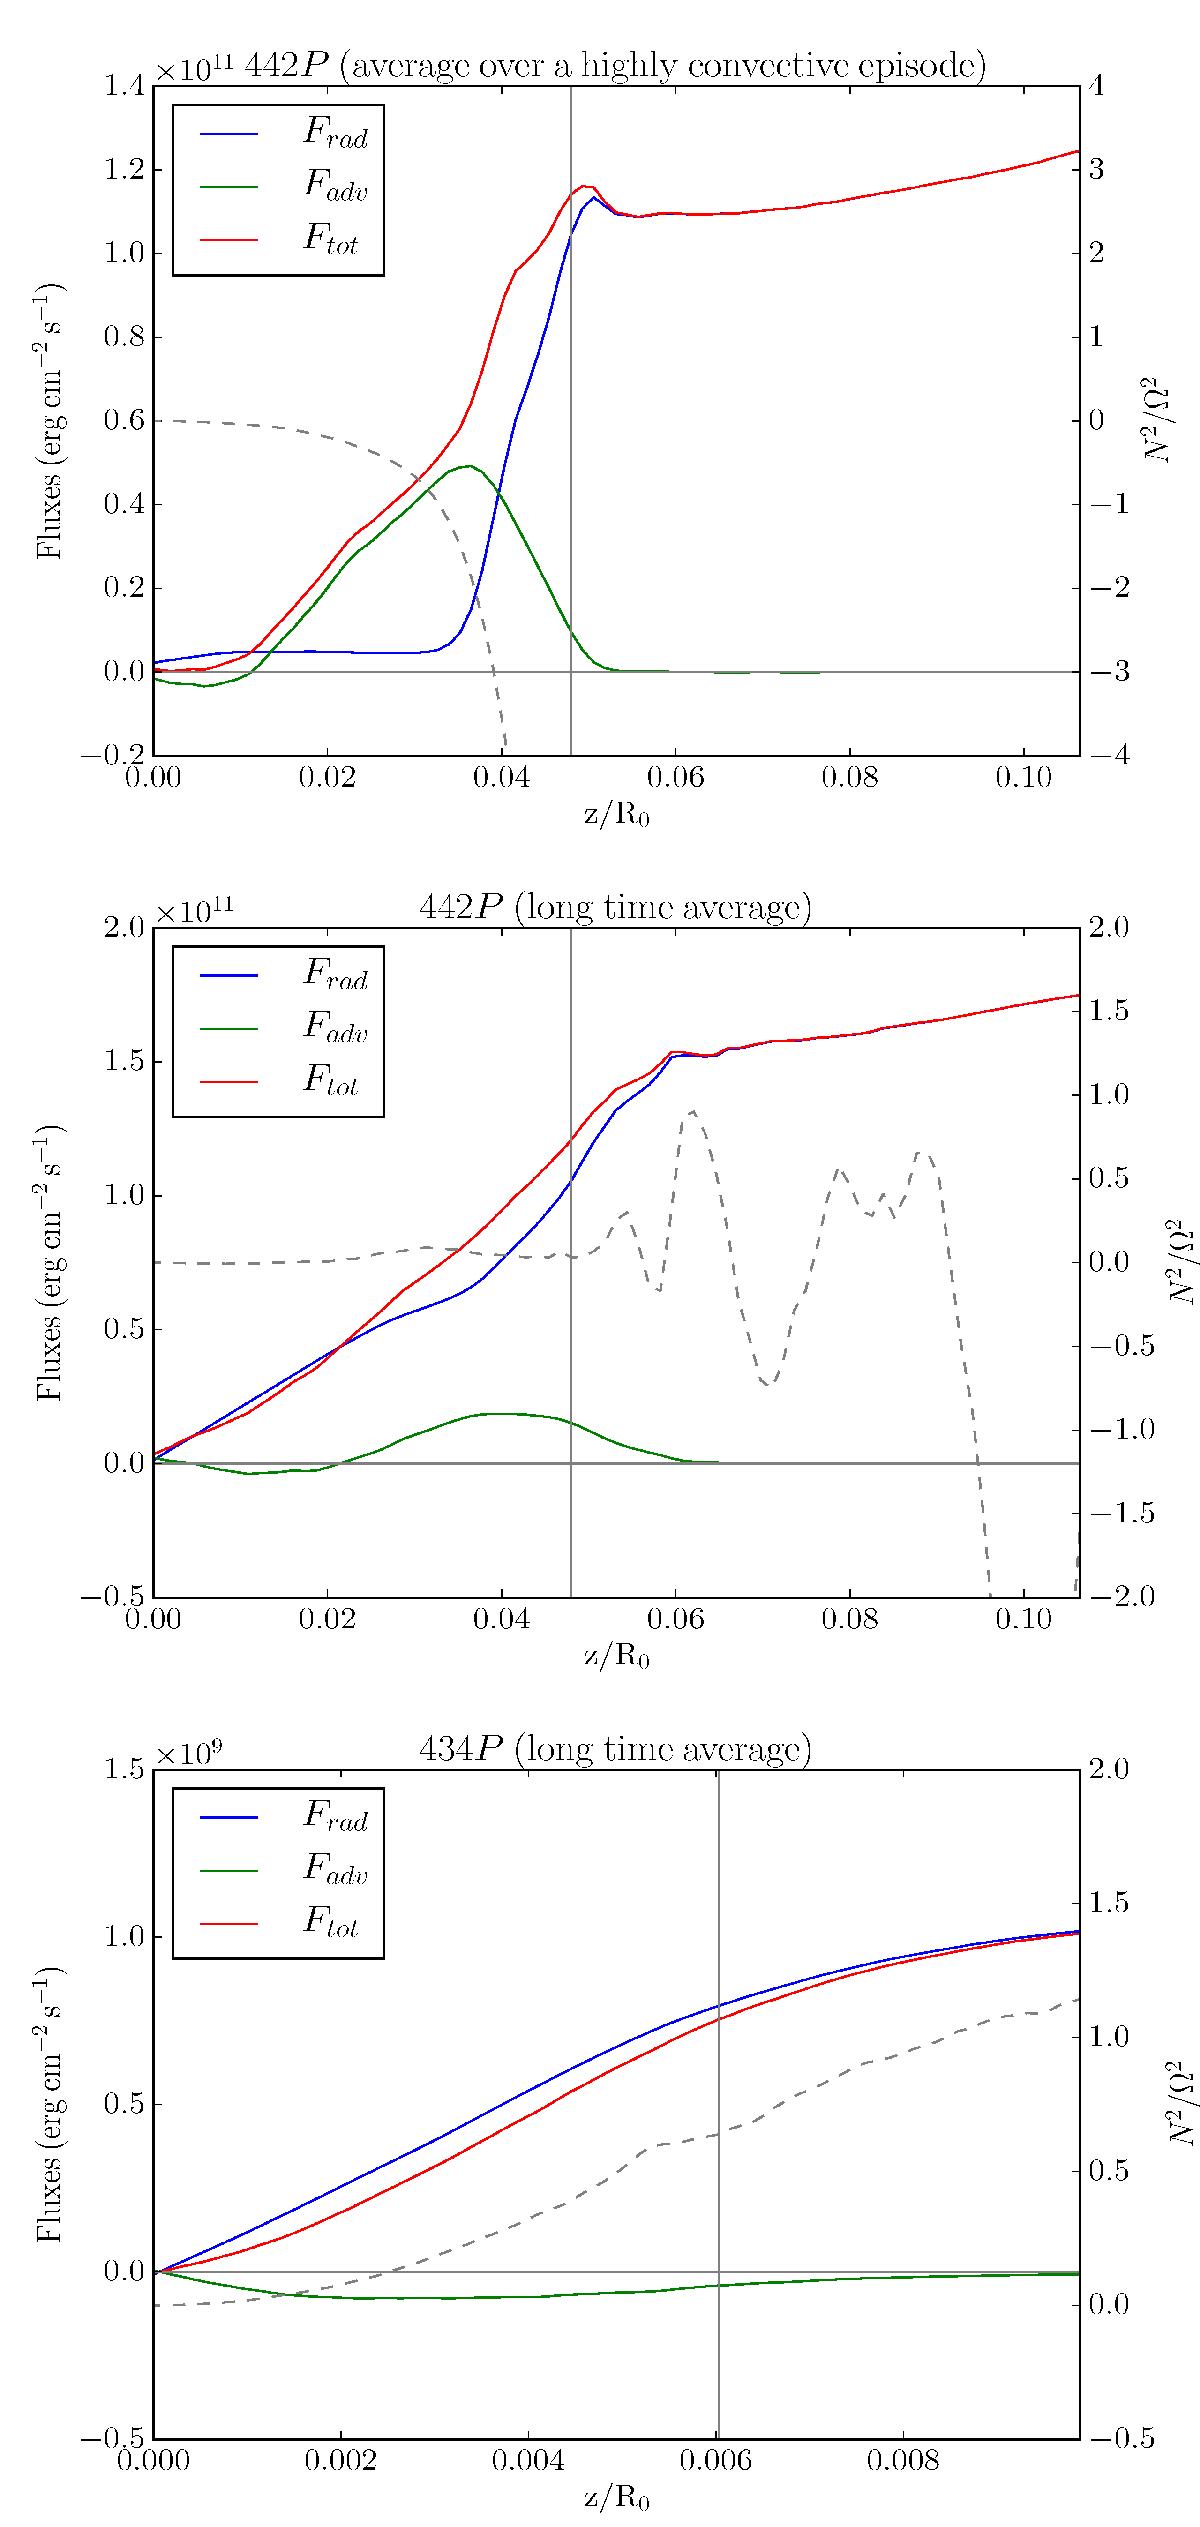
Time-averaged vertical profiles of the radiative, advective, and total flux for different runs. Top panel: run 442P during a highly convective episode. Middle panel: same run but averaging over convective and non convective episodes. Bottom panel: run 434P where there is no convection. The vertical line indicates the height above which magnetic pressure becomes larger than thermal pressure. The dashed line shows N2/ Ω2 where N is the Brunt-Väisälä frequency.
Current usage metrics show cumulative count of Article Views (full-text article views including HTML views, PDF and ePub downloads, according to the available data) and Abstracts Views on Vision4Press platform.
Data correspond to usage on the plateform after 2015. The current usage metrics is available 48-96 hours after online publication and is updated daily on week days.
Initial download of the metrics may take a while.