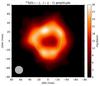
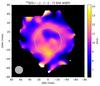
Fig. 9
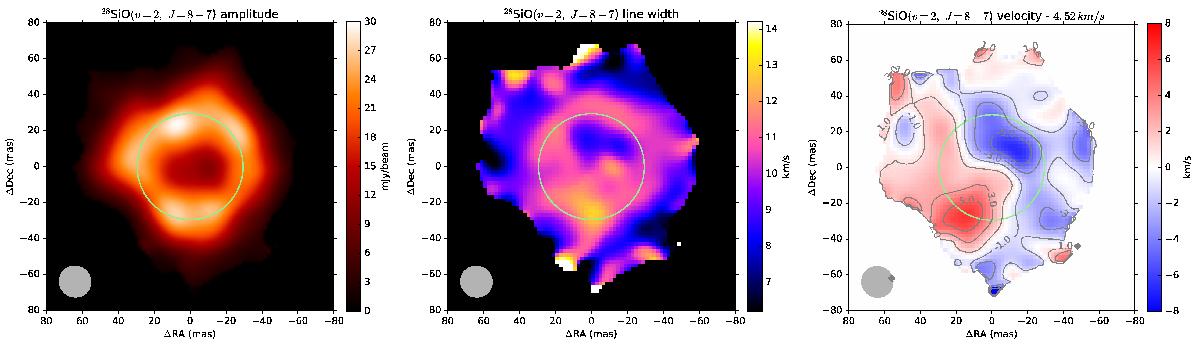
Emission line profile maps for the 28SiO(ν= 2, J = 8−7) line computed from the absorption corrected data cube. The left panel is the map of the amplitude of the best fit Gaussian, the middle panel the width of the emission line, and the right panel is the radial velocity. The systemic velocity determined from the line profile fitting is subtracted from the velocity map. The equivalent uniform disk size of the ALMA continuum emission is represented with a green circle, and the beam is shown in the lower left corner of each panel.
Current usage metrics show cumulative count of Article Views (full-text article views including HTML views, PDF and ePub downloads, according to the available data) and Abstracts Views on Vision4Press platform.
Data correspond to usage on the plateform after 2015. The current usage metrics is available 48-96 hours after online publication and is updated daily on week days.
Initial download of the metrics may take a while.