Fig. 6
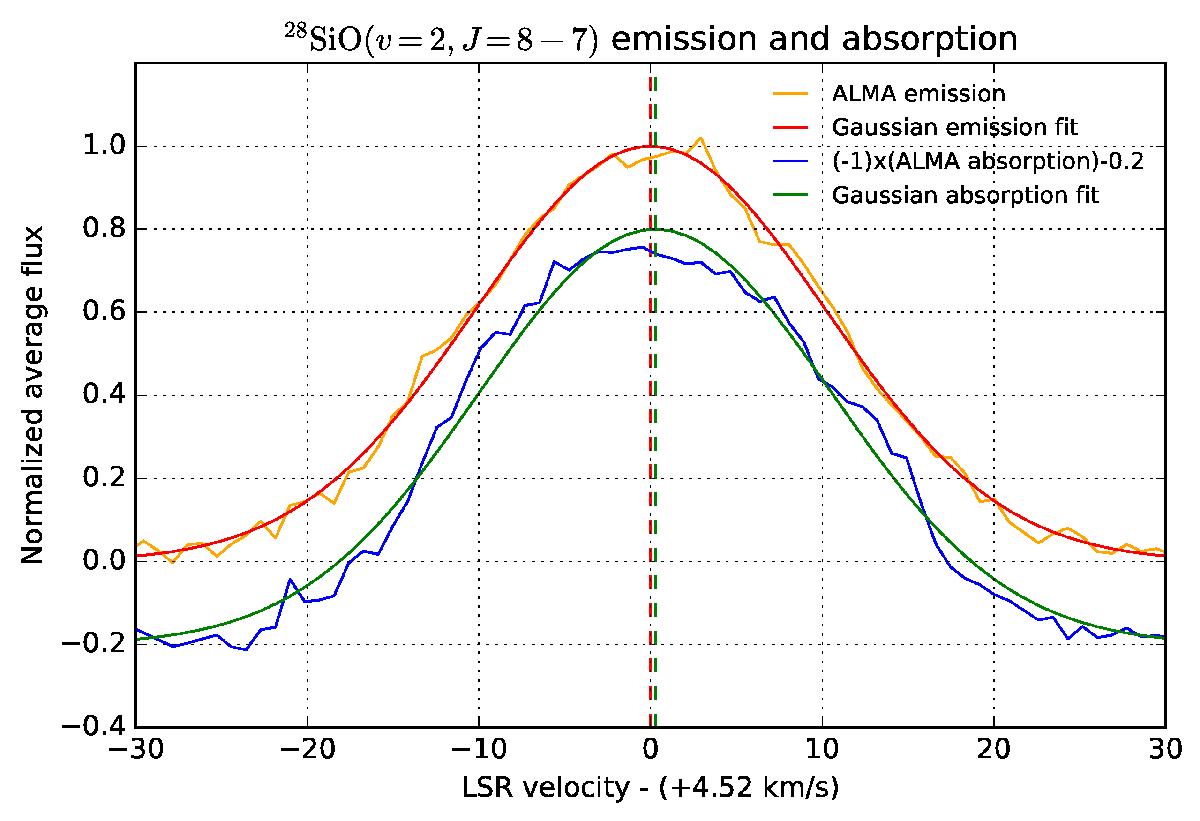
Absorption and emission normalized profiles P(f) of the 28SiO(ν= 2, J = 8−7) line. The sign of the absorption profile is inverted and shifted by −0.2 to facilitate the visual comparison with the emission profile. The absorption profile is estimated within a radius of 30 mas, and the emission profile between 30 and 50 mas (Fig. 5).
Current usage metrics show cumulative count of Article Views (full-text article views including HTML views, PDF and ePub downloads, according to the available data) and Abstracts Views on Vision4Press platform.
Data correspond to usage on the plateform after 2015. The current usage metrics is available 48-96 hours after online publication and is updated daily on week days.
Initial download of the metrics may take a while.