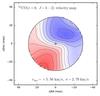
Fig. A.2
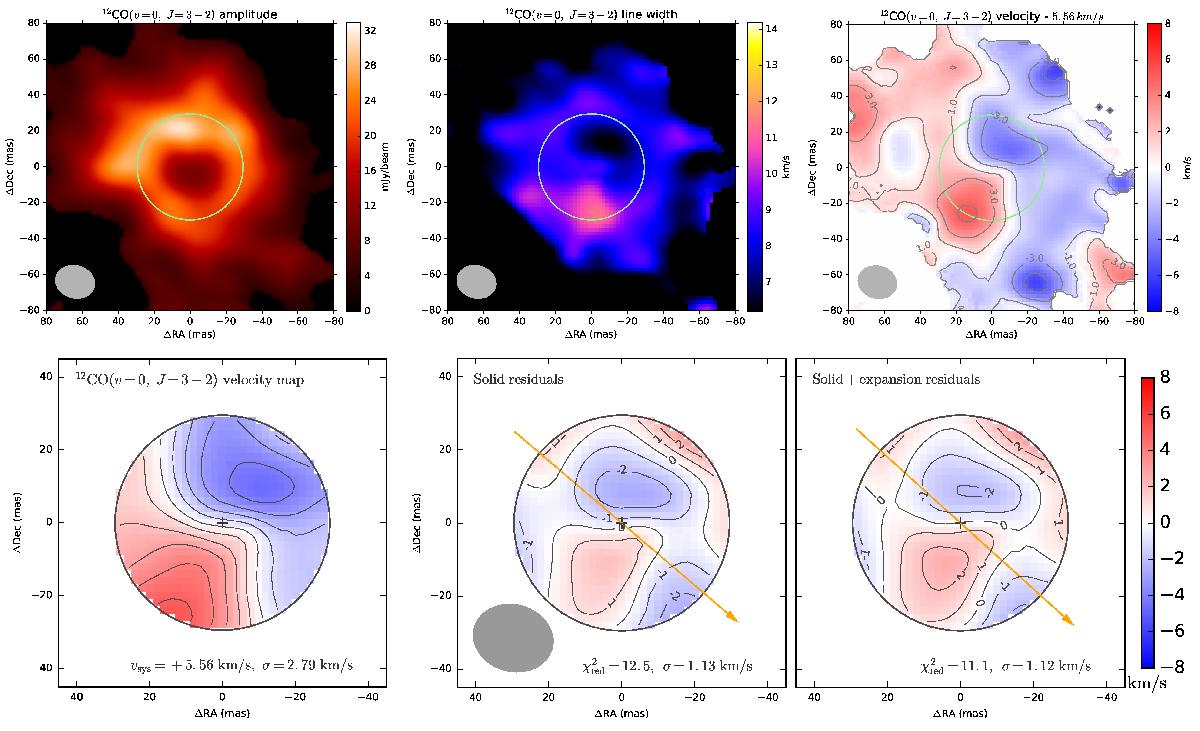
Top row: emission line profile maps of Betelgeuse for the 12CO(ν= 0,J = 3−2) line, computed from the absorption corrected data cube (see Sect. 3.2). The top left panel is the map of the amplitude of the best fit Gaussian, the top middle panel the width of the emission line, and the top right panel the velocity. The systemic velocity determined from the line profile fitting is subtracted from the velocity map. The equivalent uniform disk size of the continuum emission is represented with a green circle, and the beam is shown in the lower left corner. Bottom row: velocity map represented over the equivalent continuum disk of the star (left panel). The residuals of the fit are plotted in the center and right panels. The ALMA beam is shown in the lower left corner of the bottom center panel, and the contour levels are separated by 1 km s-1 intervals. The polar axis is represented with an arrow pointing toward the angular momentum vector for a right-handed rotating coordinate system.
Current usage metrics show cumulative count of Article Views (full-text article views including HTML views, PDF and ePub downloads, according to the available data) and Abstracts Views on Vision4Press platform.
Data correspond to usage on the plateform after 2015. The current usage metrics is available 48-96 hours after online publication and is updated daily on week days.
Initial download of the metrics may take a while.