Fig. A.1
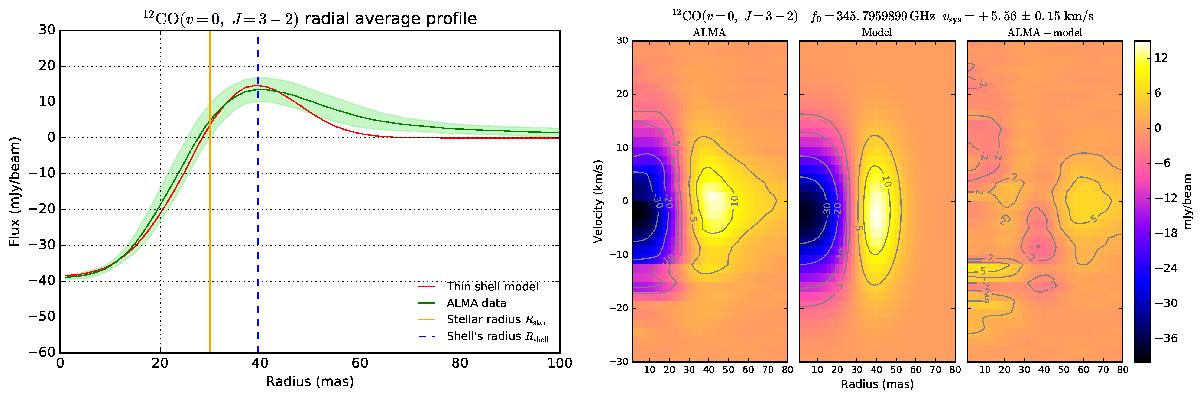
Left panel: radial average profile of the ALMA continuum subtracted observation of the 12CO(ν= 0, J = 3−2) line (green curve) and best fit model (red curve). The shaded green area is the standard deviation of the shell over the considered ring radius. The equivalent uniform disk radius of the star is shown with a solid orange line, and the radius of the shell is represented with a dashed blue line. Right panels: radial average profile as a function of the velocity offset (left panel), best fit model (center panel), and residuals of their subtraction (right panel).
Current usage metrics show cumulative count of Article Views (full-text article views including HTML views, PDF and ePub downloads, according to the available data) and Abstracts Views on Vision4Press platform.
Data correspond to usage on the plateform after 2015. The current usage metrics is available 48-96 hours after online publication and is updated daily on week days.
Initial download of the metrics may take a while.