Fig. 13
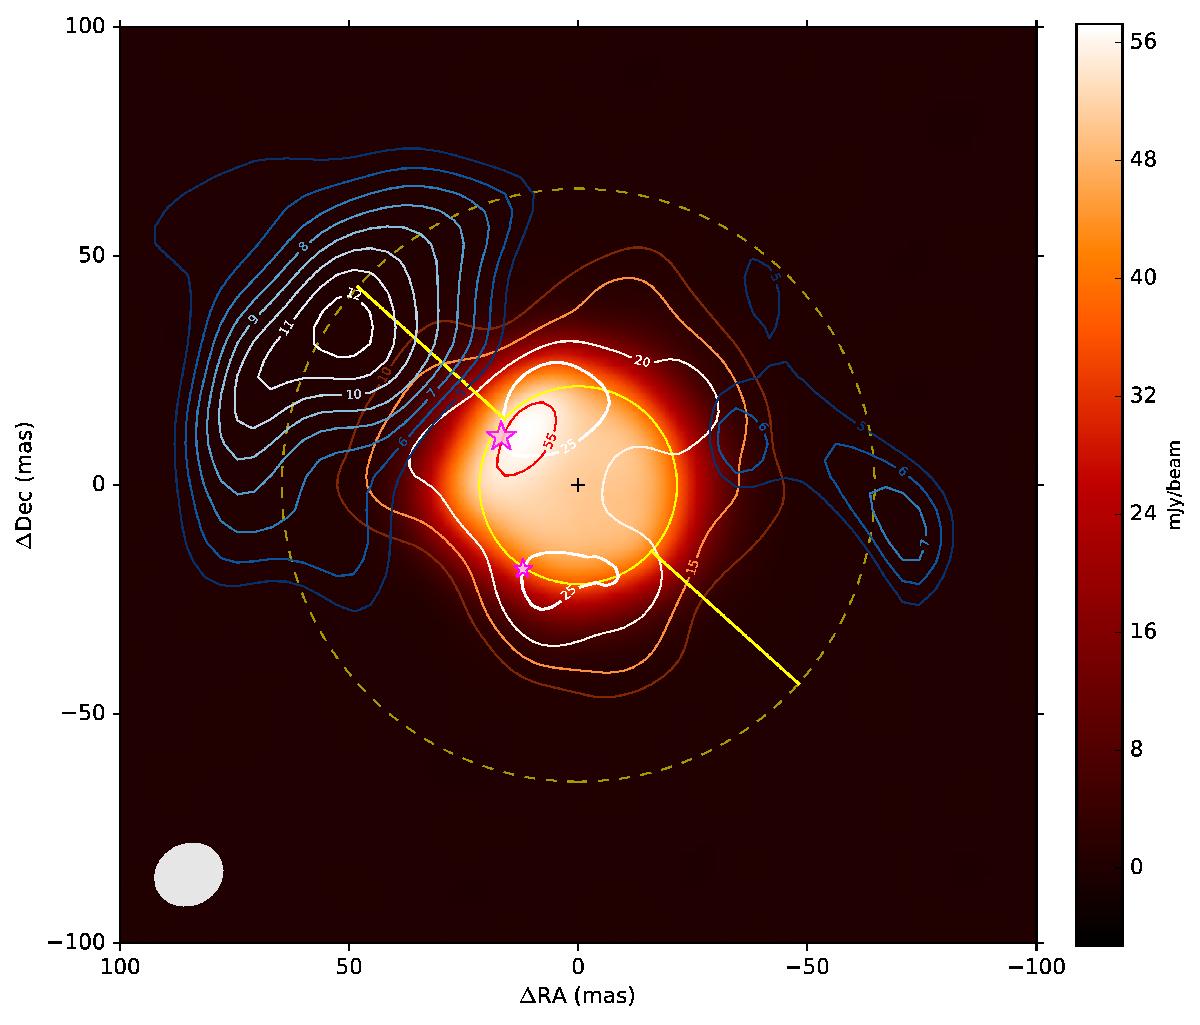
Overview of the structure of the close environment of Betelgeuse. The central star image is the ALMA continuum reconstructed image from O’Gorman et al. (2017) taken in November 2015; the associated color scale is on the right. The red contour level encircles the position of the main continuum hot spot of Betelgeuse (flux level 55 mJy beam-1). The ellipse in the lower left corner of the image shows the ALMA beam size. The solid yellow circle marks the size of the infrared photosphere as measured by Montargès et al. (2016) in November 2014, and the two yellow segments represent the direction of the rotation axis. The dashed circle is located at 3 times the infrared radius of the star. The magenta star symbols show the positions of the two spots of magnetic activity identified in spectropolarimetry by Tessore et al. (2017b) at epoch 16 October 2015. The size of the star symbol approximates the brightness of each spot. The white-orange contours represent the emission amplitude of the 28SiO(ν= 2, J = 8−7) line (labels in mJy beam-1) as determined in Sect. 3.4 (see also Fig. 9). The white-blue contours represent the degree of linear polarization measured by Kervella et al. (2016) at epoch 30 March 2015 in the CntHα filter, as a proxy for the presence of dust. The contour labels indicate the degree of linear polarization in percentage from 5 to 12%.
Current usage metrics show cumulative count of Article Views (full-text article views including HTML views, PDF and ePub downloads, according to the available data) and Abstracts Views on Vision4Press platform.
Data correspond to usage on the plateform after 2015. The current usage metrics is available 48-96 hours after online publication and is updated daily on week days.
Initial download of the metrics may take a while.