Fig. 10
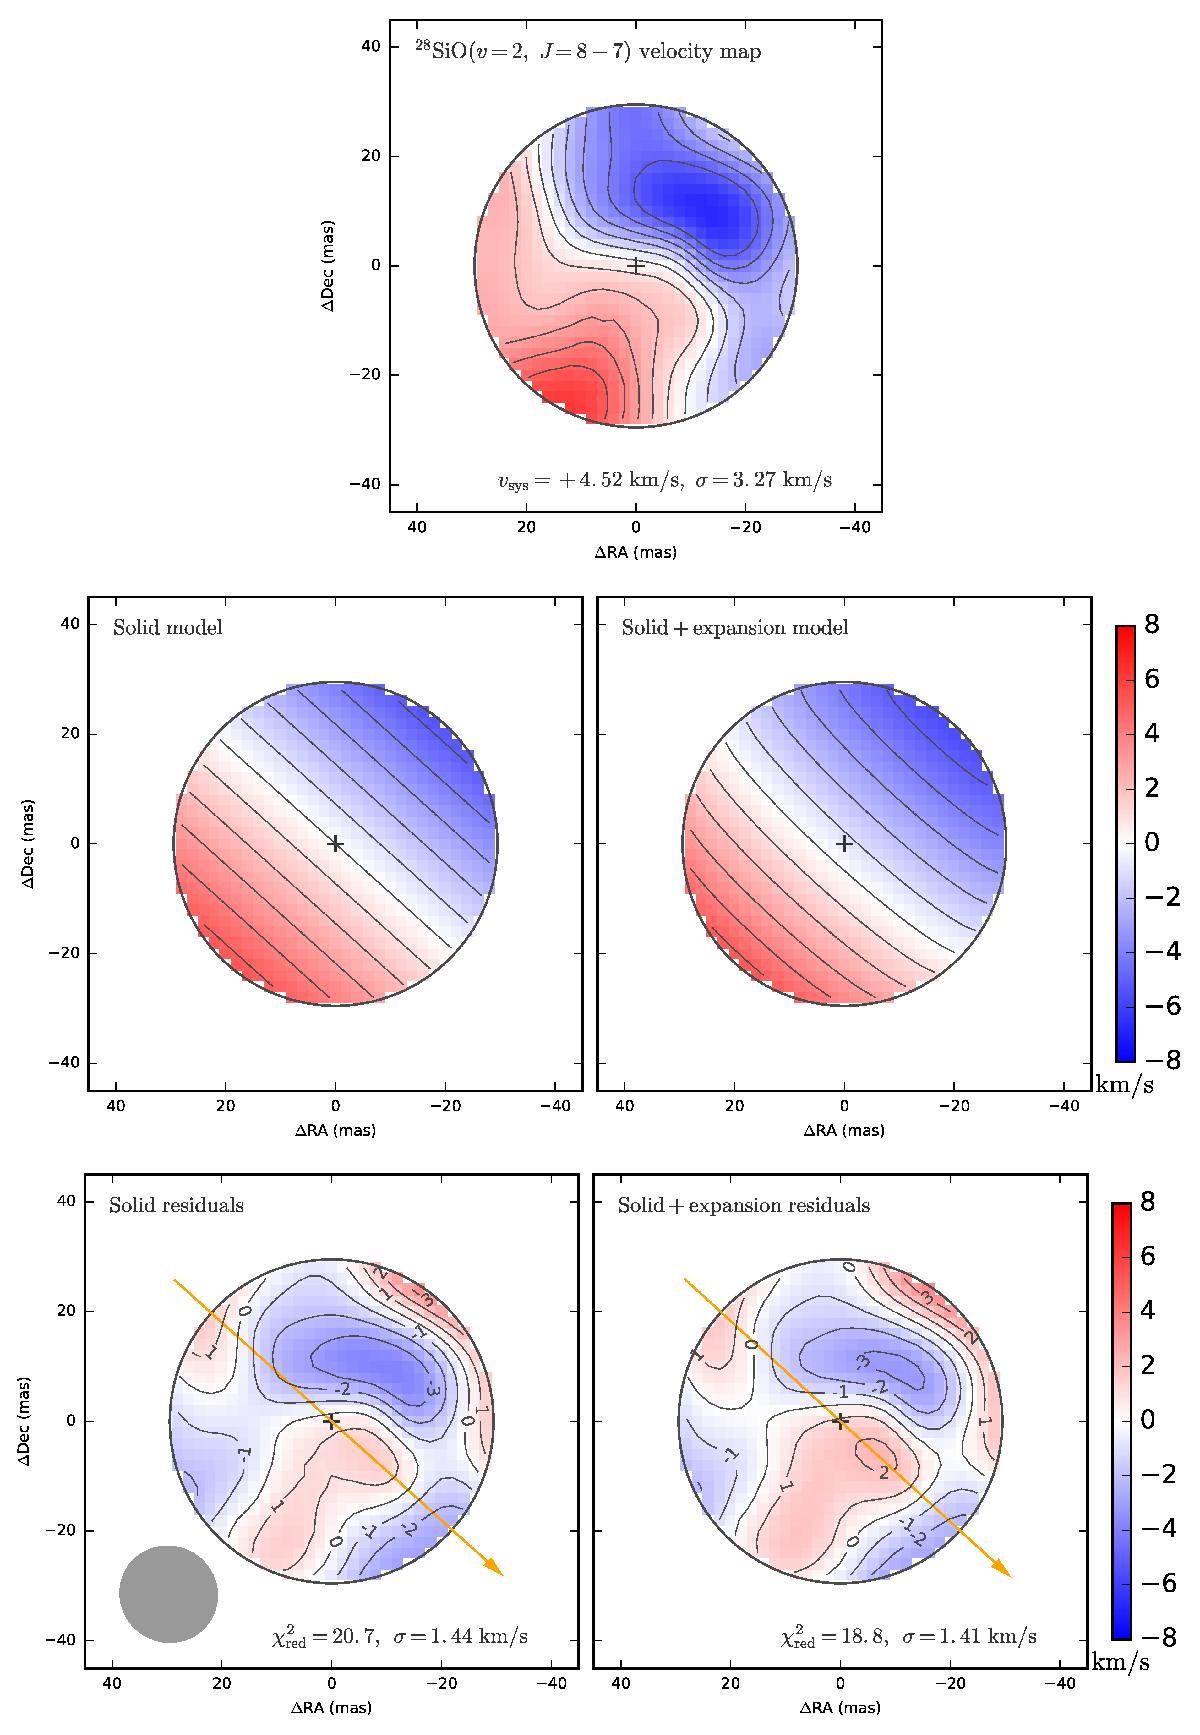
Velocity map of Betelgeuse in the 28SiO(ν= 2, J = 8−7) emission line measured over the equivalent continuum disk of the star (top panel) and best fit velocity models of Betelgeuse (center row). The corresponding model parameters are listed in Table 4. The residuals of the fit are plotted in the bottom row, and the beam is shown in the lower left corner. The contour levels are separated by 1 km s-1 intervals. The polar axis is represented with an arrow pointing toward the direction of the angular momentum vector for a right-handed rotating coordinate system.
Current usage metrics show cumulative count of Article Views (full-text article views including HTML views, PDF and ePub downloads, according to the available data) and Abstracts Views on Vision4Press platform.
Data correspond to usage on the plateform after 2015. The current usage metrics is available 48-96 hours after online publication and is updated daily on week days.
Initial download of the metrics may take a while.