Free Access
Fig. 1
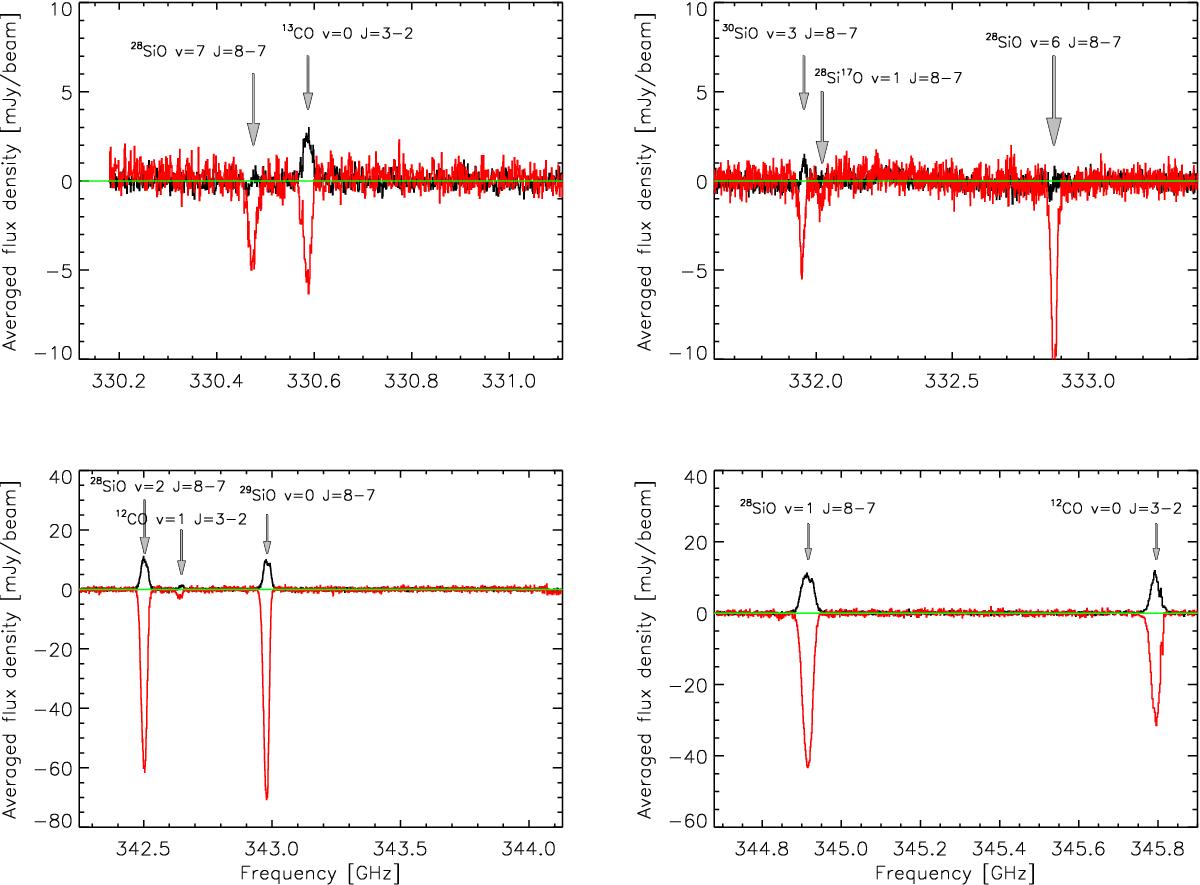
Spectra of Betelgeuse for the spectral windows spw0 to spw3 (see Table 1) with the identified spectral lines. The absorption on the stellar disk (red curve, averaged up to 20 mas from the star center) and the circumstellar emission (black curve, averaged between 30 and 40 mas in radius) are represented separately.
Current usage metrics show cumulative count of Article Views (full-text article views including HTML views, PDF and ePub downloads, according to the available data) and Abstracts Views on Vision4Press platform.
Data correspond to usage on the plateform after 2015. The current usage metrics is available 48-96 hours after online publication and is updated daily on week days.
Initial download of the metrics may take a while.