Free Access
Fig. 5
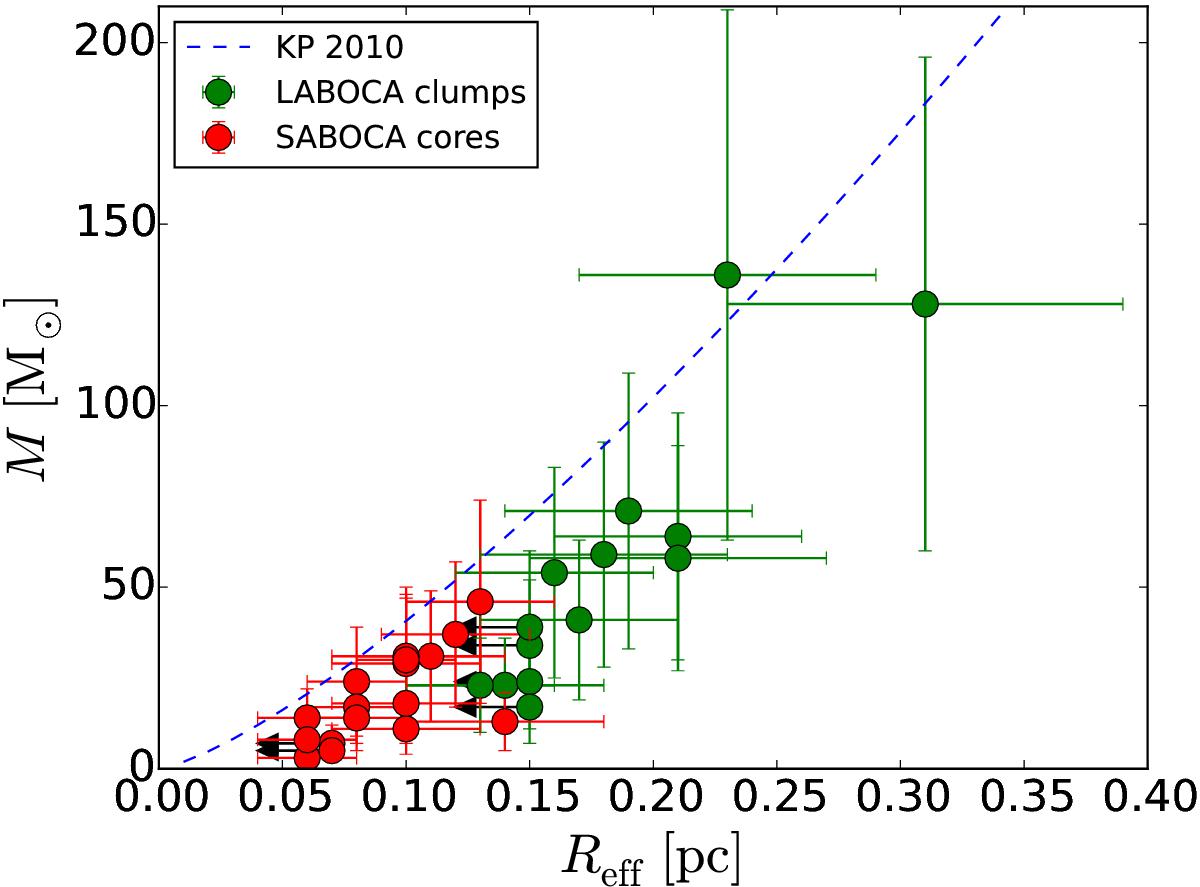
Masses of the LABOCA clumps and SABOCA cores in G304.74 plotted as a function of their effective radii. The upper size limits are indicated by left pointing arrows. The blue dashed curve represents the mass-radius threshold for high-mass star formation proposed by KP10, that is M(R) = 870 M⊙ × (R/ pc)1.33.
Current usage metrics show cumulative count of Article Views (full-text article views including HTML views, PDF and ePub downloads, according to the available data) and Abstracts Views on Vision4Press platform.
Data correspond to usage on the plateform after 2015. The current usage metrics is available 48-96 hours after online publication and is updated daily on week days.
Initial download of the metrics may take a while.